
Dogecoin price is showing mixed technical signals after slipping more than 3% over the past 24 hours, leaving market participants focused on whether the largest meme coin can defend a critical support level.
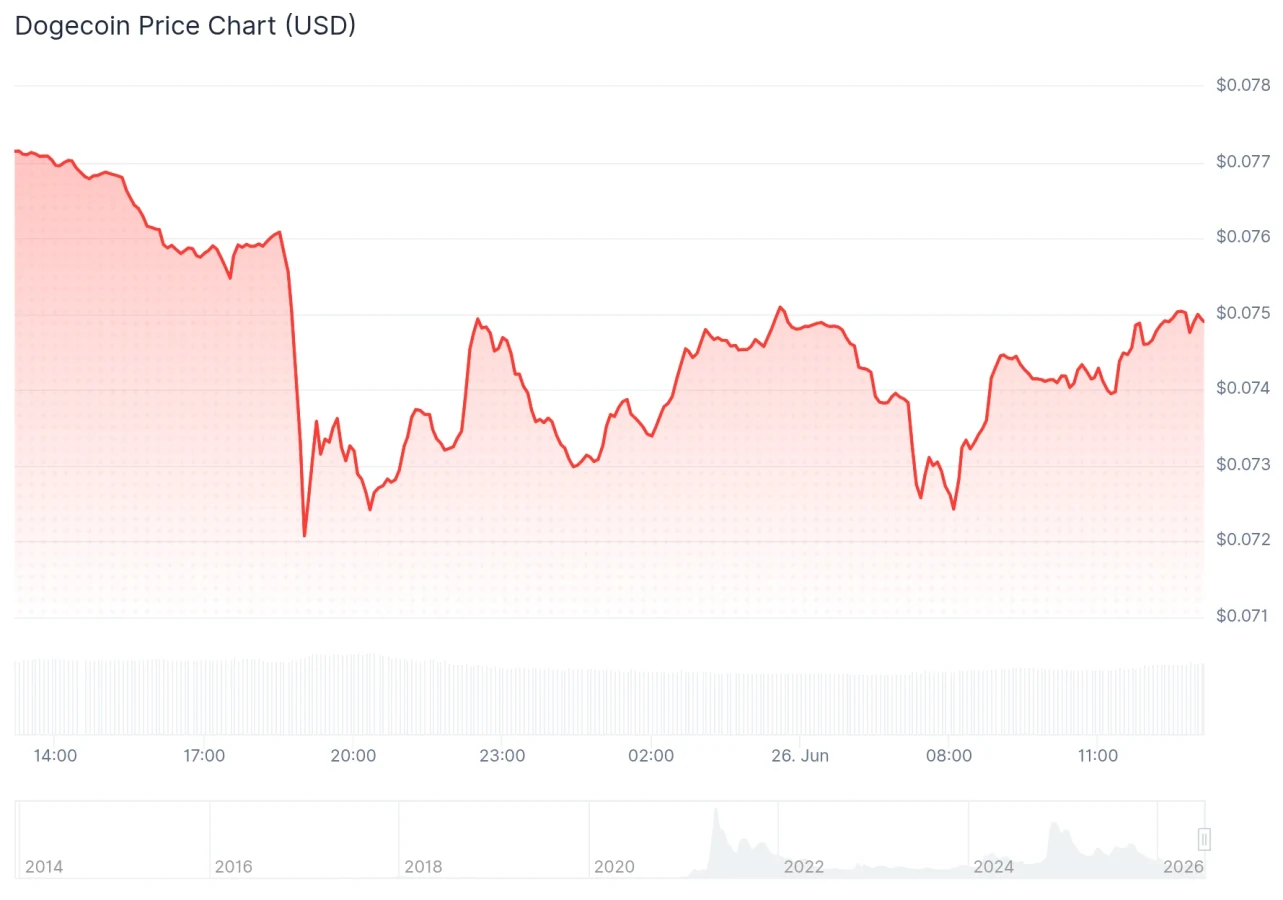
Currently, Dogecoin (DOGE) is trading at $0.07444, 3.29% down compared to yesterday’s value. The cryptocurrency has seen $1.40 billion in volume within one day while having a market capitalization of $12.69 billion, representing 0.61% of the total cryptocurrency market. The recent decline caused Dogecoin price to face an important technical level.
Also Read | AscendEX Withdrawal Crisis Sparks Liquidity Concerns in 2026
Dogecoin Price Target Near $0.081 Upside
Crypto market analyst Ali Martinez mentioned that the TD Sequential indicator has provided a signal to buy on the Dogecoin price chart, which means that there is less sell-off pressure in the near term.
Analyst says that $0.073 is now the most important level to follow in order to see whether the price will move up to $0.081. The breakdown of this level will mean that the bullish pattern is no longer valid.
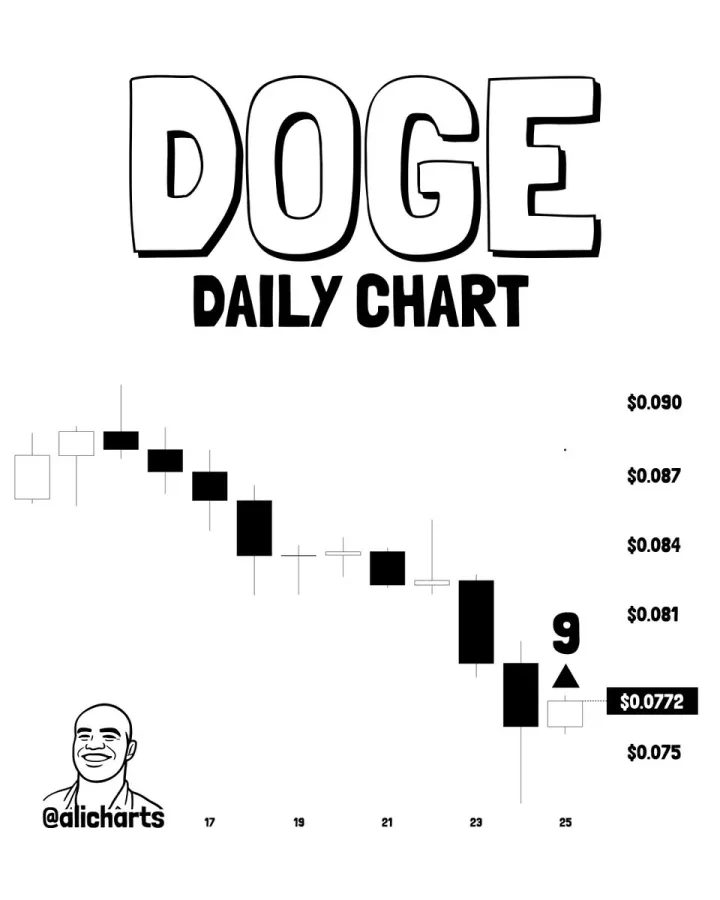
The TD Sequential is widely applied by traders in order to predict the turning points after a lengthy price movement. Although it does not guarantee a reversal, the signal often attracts attention because it has previously identified areas where buying interest returned after periods of weakness.
Dogecoin Price Risks Deeper Monthly Decline
Despite the improvement of the near-term situation on the Dogecoin price chart, another market analyst has found bearish factors on the monthly chart of the asset. On the chart, Dogecoin price has moved below the 100-month moving average, which served as a support level in the last four months.
In case the monthly candle closes below this level, the analyst sees it as the confirmation of a bearish phase of the market. Dogecoin could decline to the level of $0.058, which is a high boundary of the four-year support zone.

This analyst also says that the mentioned level coincides with the Dogecoin 11-year higher lows trend line, which marked previous major cycle lows in history of the crypto. Besides, Dogecoin 11-year lower lows RSI trend line was used as the signal of a long-term buying opportunity in previous cycles.
Technical Support Failure Increases Selling Pressure
Technical support levels often become areas where buying and selling activity increases. As the price stays above the support level, market confidence grows since buyers continue defending it. In case the support breaches, the selling pressure will rise since investors will exit their long positions.
In the case of Dogecoin, the maintenance or breakdown of the level of $0.073 will affect further price dynamics. In addition, the monthly closing price will have a significant meaning for the rest of the current market cycle.
This article contains market analysis and price predictions. These are not guarantees. Crypto markets are volatile. Always DYOR. Not financial advice.
Also Read | Ondo Finance Unlocks 24/7 Trading for Tokenized Stocks