• Skip to primary navigation
  • Skip to main content
  • Skip to primary sidebar
  • Skip to footer
  • About us
  • Write for us
  • Terms and Conditions
  • Privacy Policy
  • Disclaimer
  • Contact
  • All Posts
  • Advertise

TronWeekly

Crypto World News

  • Home
  • Education
    • Best TRON Wallets
    • Beginner’s guide to TRON
  • Opinion
    • Tron Tokens
    • Market Analysis
  • Industry
    • Tron Exchange
    • Project Review
  • Press Release
  • Advertise
  • About us
    • The Team
    • Editorial Policy
    • Write for us
    • Privacy Policy
    • Disclaimer
    • Terms and Conditions
    • Contact
You are here: Home / News / DOT prices rebound as market tries to overcome bearish trend
DOT

DOT prices rebound as market tries to overcome bearish trend

November 19, 2021 by Parth Dubey

A few days ago, the market turned bearish as Bitcoin fell 16% from its all-time high at $69,000. DOT prices have also been bearish, currently 26.89% down from its all-time high witnessed on Nov 5.

While the market retains its bearish stance, the entire crypto industry is looking to regain lost support levels. As per data from CoinmarketCap, the 24-hour trading volume for Polkadot [DOT] rests at 2.1 billion USD, which is a hike from 31.30% in the last 24-hours.

On the other hand, the market capitalization of the token rests at $39.7 billion, awarding the 8th rank to Polkadot. The price action still lacks volume on the daily chart.

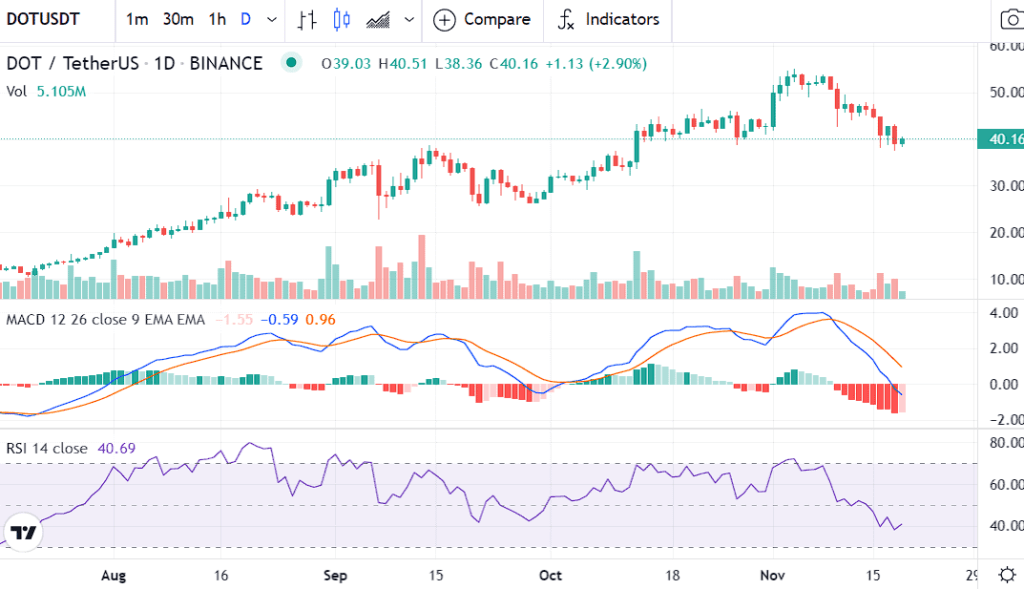
DOT price analysis on the daily chart

Polkadot recently hosted its first parachain auctions that turned the prices bullish for the token. The price action saw a new all-time high, with Acala winning the first round for the parachain auction.

Furthermore the technical indicators have turned bearish for the price action. The price momentum is trying to break down from the lower end of the Bollinger Bands as bears take over the market.

The 100-day Moving Averages remain below the price action while the prices drop below the 50-day Moving Average.

DOT
Polkadot price analysis on the chart by TradingView

The RSI entered the bearish zone, moving towards the 40-level. However, the market remains bearish on the whole. The gradient has turned positive, i.e., higher prices are possible for the near future.

The MACD line is also bearish with a histogram full of red bars and the orange line (signal line) progressing above the MACD line (the blue one). The selling pressure is high as buyers are unable to take the prices higher.

DOT chart
Polkadot price analysis on the chart by TradingView

Conclusion

As inflation continues to thrive, deflationary assets are now in-demand. While the entire market is still stabilizing, Bitcoin will definitely move higher in the coming weeks, and so will Polkadot.

Filed Under: News, Altcoin News Tagged With: DOT, polkadot

Primary Sidebar

Recent Posts

  • Is Shiba Inu Easy to Buy and Sell in Europe? May 21, 2022
  • OpenSea Deploy New Web3 “Seaport” Marketplace On Ethereum May 21, 2022
  • Dogecoin co-founder states the obvious yet again May 21, 2022
  • Bitcoin to shine bright like a diamond May 20, 2022
  • Singapore Court, Following a Dispute, Barred the Sale of Bored Ape Yacht Club NFTs May 20, 2022

Footer

News

  • Altcoin News
  • Bitcoin News
  • Blockchain
  • Tron News
  • World

Digest

  • Meet the Founder
  • Price Winning Article
  • DeFi
  • Cyber Security
  • Crypto Scam

Industry

  • Project Review
  • Technology
  • Fintech
  • Tron Exchange
  • New in Town

Tron Universe

  • Event and Tron Parties
  • New in Town
  • Tron Tokens

Follow Us

Subscribe US

Copyright © 2022 · Tron Weekly. All Rights Reserved. NOTE: Tron Weekly is an independent crypto news site that adheres to the strict journalism policy anchored on transparency, trust, and objectivity, we have no affiliation with the TRON Foundation, its founder Justin Sun or any other cryptocurrency firm.