DOT price continues to stay above a critical breakout support region amid the recent selling activity, maintaining the overall positive outlook intact. According to an analyst, protecting this region will help lay the foundation for a stronger upturn move.
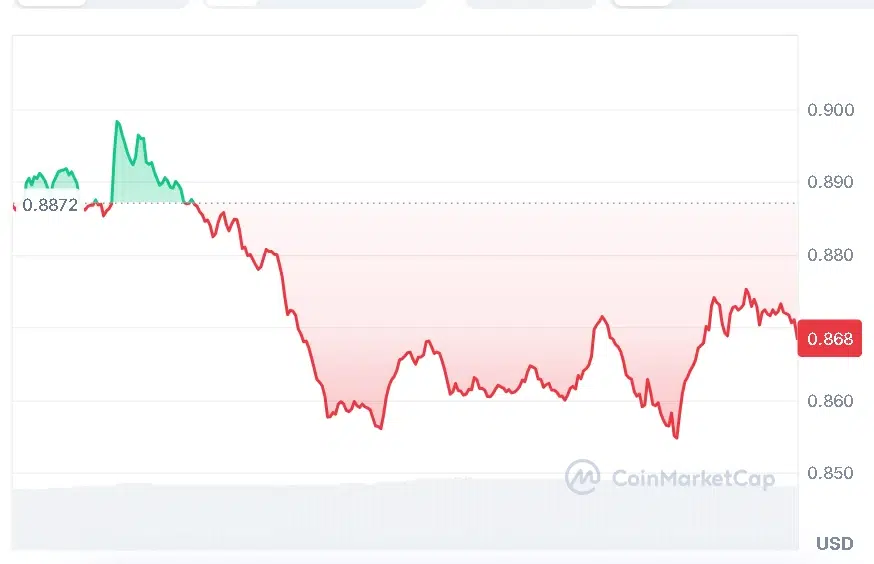
At the time of writing, DOT is trading at $0.8683, down 2.42% over the last 24 hours. The DOT has recorded $136.89 million in 24-hour trading volume while maintaining a market capitalization of approximately $1.48 billion, showing that market activity remains steady despite the recent decline.
Also Read | Polymarket Sued in New York Over Strategy Bitcoin Market Payouts
DOT Price Signals Possible Rebound
On July 7, 2026, a crypto analyst, Alpha Crypto Signal, released a new technical analysis in which he indicated that Polkadot does not have the best chart formation among other cryptos. But he believes that the chart formation is good as long as the DOT price is above its rounding bottom breakout area.

As per the analysis, this breakout region now acts as a key support level after the initial breakout. Provided that buyers defend this region, it can lead to an upside move in the coming weeks.
Additionally, Alpha Crypto Signal mentioned that a lack of support could lead to the breakdown of the present bullish formation and create further risks for a downturn. Meanwhile, being above the breakout point suggests a good long-term perspective.
DOT Price Shows Improving Technical Strength
New technical indicators point towards the gradual rise in buying activity amid the most recent correction. The upper resistance level in Bollinger Bands is positioned at $0.9834, the middle one is located at $0.8802, and the lower support line is positioned at $0.7770. Having rebounded off the lower line, the DOT price now tests the middle one.
A break above $0.8802 will strengthen the immediate outlook and boost chances of challenging resistance. If sellers take back control, $0.7770 will become the significant level to watch out for.
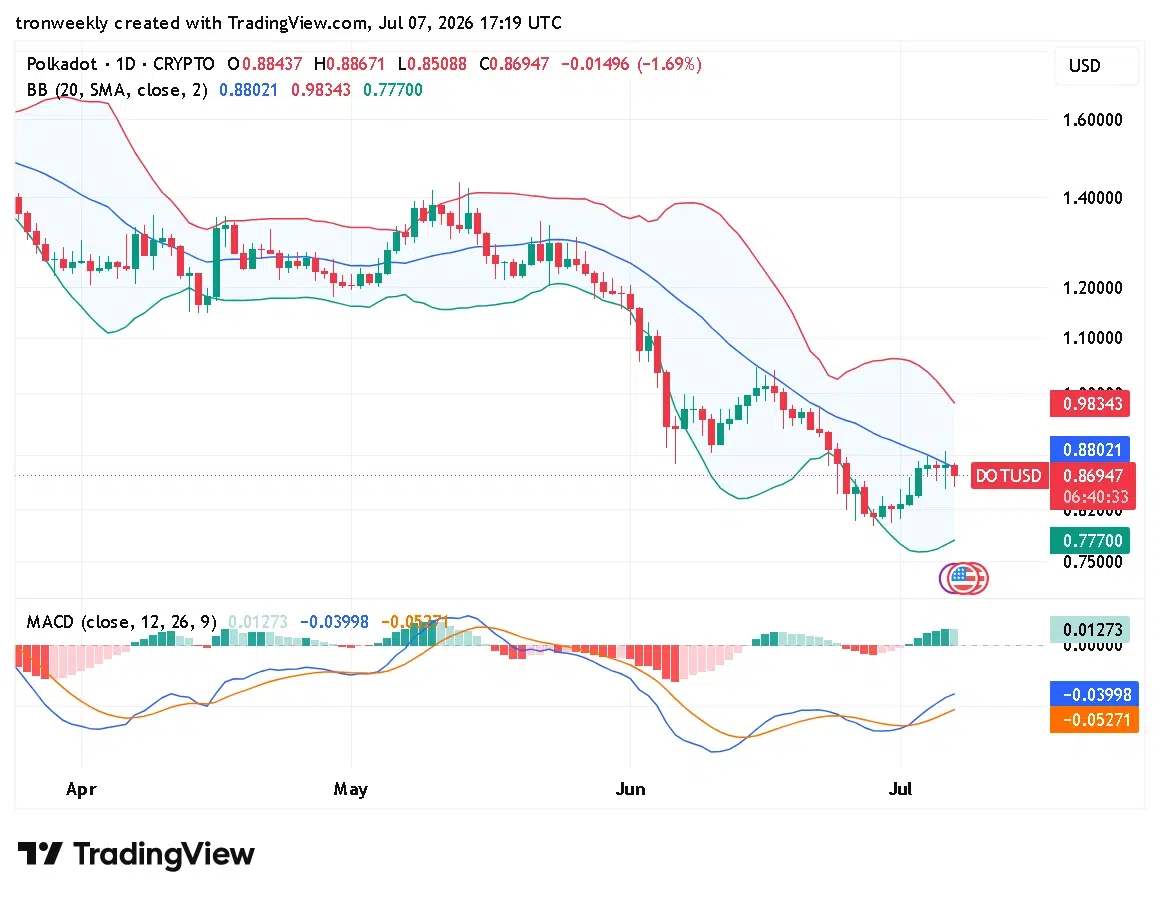
MACD indicates a positive momentum as the MACD line of -0.03998 is trading above the signal line of -0.05271. Moreover, the histogram is positive with a reading of 0.01273, indicating a possible bullish momentum ahead of the current bounce. Polkadot may witness additional upside if the present trend persists; however, confirmation is required from buyers.
Can DOT Price Break Above $0.88 Next?
In the coming days, Polkadot could see some interesting action. In case DOT price manages to stay above its breakout area and manages to climb above $0.8802, there is a possibility that it could move towards $0.9834.
However, in case the support gives way, more selling may follow, and the focus might turn on the $0.7770 support level. At the moment, technical analysis shows that the rebound is strengthening; however, the buyers require some additional confirmation for the new uptrend.
This article contains market analysis and price predictions. These are not guarantees. Crypto markets are volatile. Always DYOR. Not financial advice.
Also Read | Litecoin Price Prediction Turns Bullish: Can LTC Hit $50 Next?