
Ethereum demonstrates an initial bullish signal, as it attempts to take back a particular price level where it may find itself for the next phase. Prices remain in a narrow range, with conflicting technical signals without any breakout formation. A breakout above this level is a crucial structural development for Ethereum.
At the time of writing, Ethereum is trading at $2,324.25, according to CoinMarketCap data, with a 24-hour trading volume of $23.42 billion and a market capitalization of $280.16 billion. Over the last 24 hours, ETH has recorded a 1.68% gain, showing steady but controlled upward movement in price action.

Also Read | SUI Extends Downtrend as CME Futures Launch Triggers Rising Selling Pressure
Ethereum Attempts Key Level Recovery
A crypto analyst, Ali Martinez, pointed out on April 29, 2026, that Ethereum was trying to regain its Realized Price of $2,335. This price is significant because it indicates the average cost basis of the on-chain participants.

Martinez noted that when ETH successfully moves above this zone and sustains it, it often signals the early stages of a stronger bullish phase. Historically, reclaiming realized price levels has acted as a foundation for extended market rallies during cycle expansions.
MVRV Bands Point to Higher Potential
Looking at MVRV pricing bands, the next major area of interest sits at the 2.4 MVRV band, currently near $5,600. This zone represents a higher valuation region that Ethereum has previously reached during strong momentum phases after reclaiming key cost levels.
However, the immediate emphasis will be on confirming the breakout. ETH needs to consolidate above $2,335 before anything is considered. Success here would help fortify the underlying structural basis for a subsequent push towards the higher price ranges.
Ethereum Momentum Fades at Support
The technical setup of Ethereum demonstrates a combination of power and caution. The RSI reading stands at 54.09 with the signal line at around 56.54, signaling a weak uptrend without any significant momentum. Ethereum is currently hovering around its Moving Average Ribbon, with critical support zones at $2,321.64, $2,212.22, and $2,200.17.
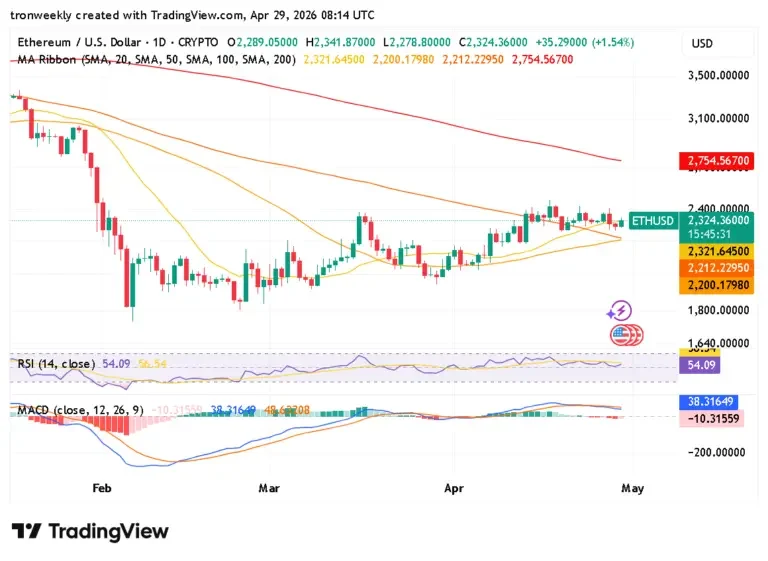
These zones are providing temporary support zones and keeping prices stable. Nevertheless, the 200-day moving average at $2,754.56 still remains significantly higher than the current price, showing that the overall trend has not yet fully shifted to a bullish trend.
On the MACD indicator, the MACD line is now at 38.31 and the signal line at 48.63; this indicates that there has been some reduction in buying pressure. In addition, the histogram has entered the red zone, which is now at about -10.31.
Ethereum Faces Key Breakout Zone
Overall, Ethereum is still at an extremely crucial technical level. The major level that needs to be watched out for is $2,335. This particular price level works as the trigger for the price direction in the short term. Breakout and sustained holding above this level would favor further gains.
This article contains market analysis and price predictions. These are not guarantees. Crypto markets are volatile. Always DYOR. Not financial advice.
Also Read | JASMY Falling Wedge Pattern Hints at Possible Rally Toward $0.021 Target