
Ethereum is rapidly approaching an important technical turning point based on the latest on-chain data that shows a number of previous price thresholds, where previous major market cycles have formed.
Ethereum may be approaching a decisive technical turning point as new on-chain data highlights price levels that historically defined major market cycles.
In a March 15 post on X, Alphractal CEO Joao Wedson identified several Ethereum valuation metrics, including realized price, investor price, and delta price, that traders are monitoring as potential support and resistance zones.
Realized Price Becomes Immediate Resistance
In his analysis, the Alphractal CEO indicated that the main resistance area in the current market structure is Ethereum’s realized price at $2,191. Realized price is the average price at which all existing, or circulating ETH, were last traded on-chain.
Investors focus on realized prices because when the current price of a token falls below the realized price, many will hold their coins in unrealized losses, leading to sell pressure. According to TradingView data, Ethereum is currently trading at approximately $2,109 and is up 0.69% in the last day.
The token appears to be consolidating following the recent price volatility. However, the current price remains below the realized price area. Therefore, the $2,191 area may ultimately determine if Ethereum enters a strong recovery phase or declines further.
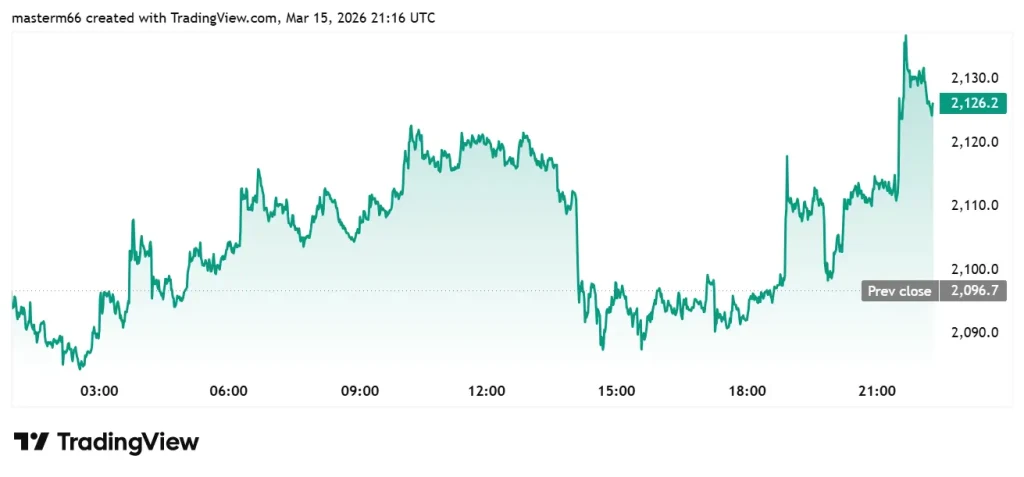
Source: TradingView
Also Read | Ethereum Climbs Above $2,100, Eyes $2,400 as Rally Gains Momentum
Investor Price and Average Price Provide Major Support Levels
A second important area, according to Wedson, is the investor price, which is currently at approximately $1,700. According to Wedson, this price level served as the low in Ethereum’s market cycle in January 2026.
It also represented a key area of support throughout several of the pullback periods in 2025. Historical data indicate that when Ethereum trades below its average price of approximately $1,278, it signals extreme fear in the marketplace.
This level has historically marked the beginning of large-scale buying interest among investors. Since these models are developed using actual on-chain data, they provide investors with a greater understanding of the long-term psychological dynamics of the marketplace.
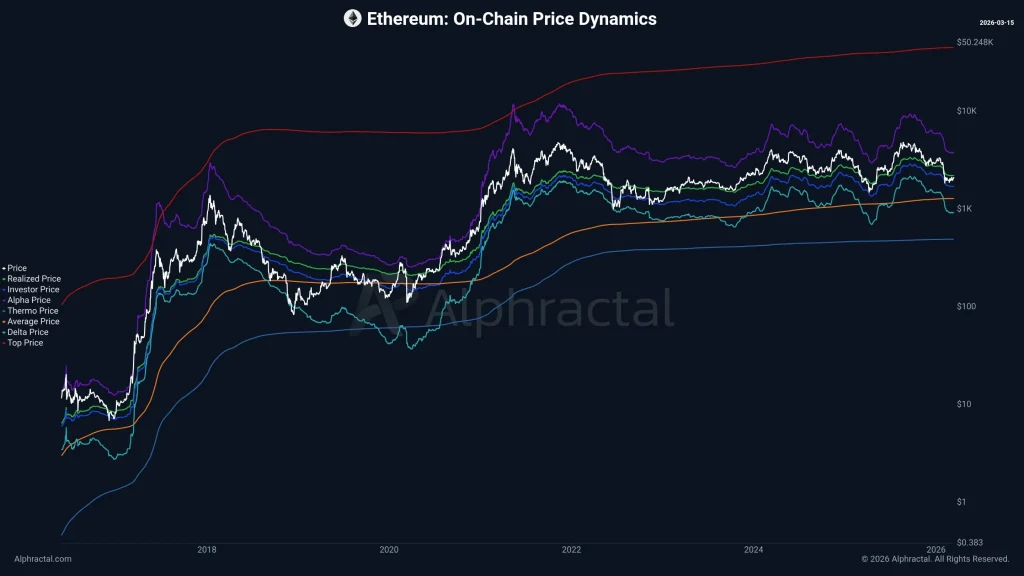
Source: X
Delta Price Signals Market Cycles Bottoms
The third and final area analyzed is the delta price, currently around $917. Wedson pointed out that the delta price has historically indicated the absolute bottom for Ethereum’s market cycles.
The delta price can continue to climb upward over time as the behavior of on-chain participants evolves. It has consistently provided a long-term valuation floor during previous downturns. As such, analysts consider the delta price as a long-term “capitulation zone” that provides a signal for the deepest stage of a crypto bear market.
Neutral Technical Analysis
According to technical data from TradingView, Ethereum is extremely close to its 200-day EMA of approximately $2,101 as the token is attempting to establish a long-term trendline. The RSI is currently at approximately 57, indicating neutral momentum with no sign of becoming overbought.
Additionally, the volume has been stable, indicating that investors are awaiting additional price catalysts to confirm trend direction before establishing their positions.

Source: TradingView
Why This Matters
Understanding how on-chain valuation models function allows investors to establish long-term support and resistance levels that often represent major turning points in crypto market cycles.
This article contains market analysis and price predictions. These are not guarantees. Crypto markets are volatile. Always DYOR. Not financial advice.
Also Read | Ethereum Foundation Sells $10.38M in ETH via OTC Deal