
Ethereum prices are bearish in the short term, dropping nearly 16.50% from its all-time high of 4,859.50 USD, witnessed on Nov 10. In the last 24 hours, prices rose from 3,990.68 USD to 4,162.30 USD.
Furthermore, in the last seven days, Ether (ETH) prices have fallen by 8.2% as per CoinGecko, followed by a 12.8% in the past 14 days. However, in the past 30 days, a 5.1% was witnessed by traders.
In the past 52 weeks, Ethereum prices ran from 531.99 USD to 4,891 USD. Currently, the token is ranked 2nd on the market, with a circulating supply of 118,521,136 ETH.
According to the data presented by CoinMarketCap, the trading volume of the token rose by 35.91% in the last 24 hours, followed by a 2.07% drop in the market capitalization, which is currently at 480 billion USD.
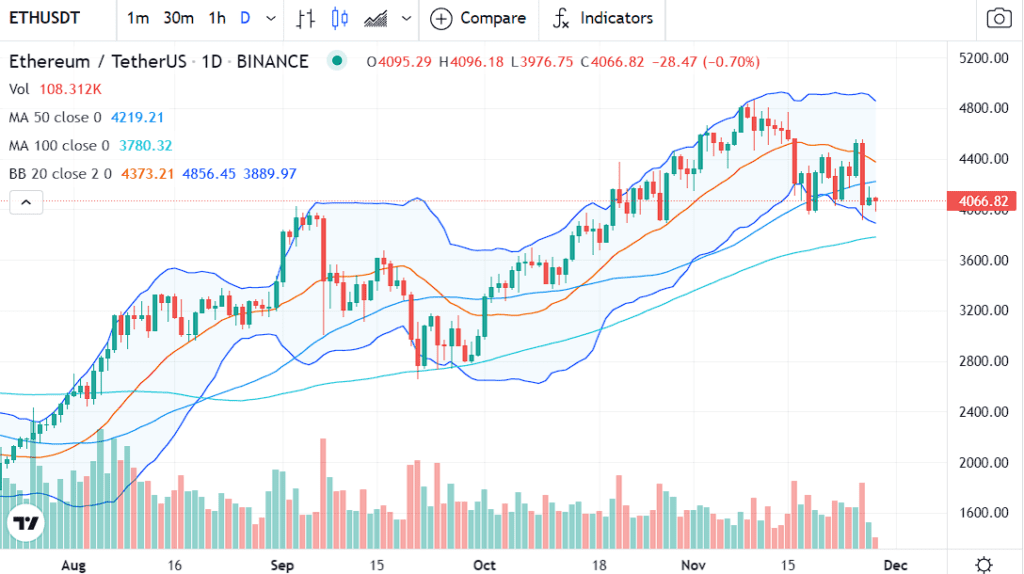
Ethereum price analysis on the daily chart
Ethereum price analysis on the daily chart shows a bullish long-term trend. The prices dropped below the 50-day Moving Average and turned bearish for the short term. However, the 100-day Moving Average remains as a support level.
The prices rest in the lower end of the Bollinger Bands, which means that if volumes drop further and bears take over, we might witness a breakout from the lower end of the Bands.
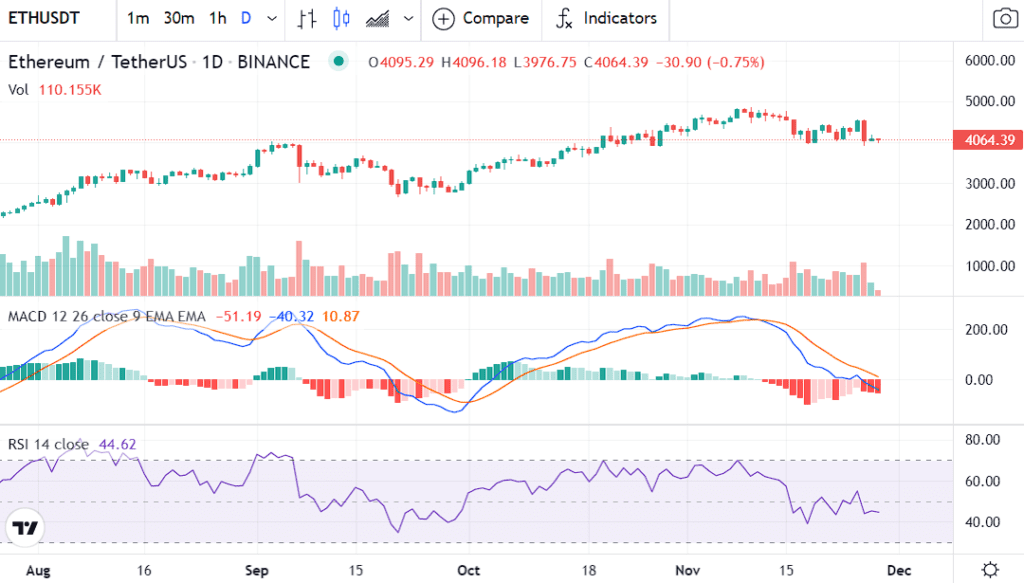
The MACD indicator is also bearish as the MACD line, i.e., the blue line, is progressing below the signal line, i.e., the orange one. This is further demonstrated by the MACD histogram, which is bearish and full of red bars, hinting that the bears are in the chart.
The RSI indicator is also bearish as the line has entered the bearish zone as the gradient is slightly negative. This negative trend indicates that prices might fall further.
Conclusion
Ethereum prices remain bearish for today, with a drop in trading volumes as well. The rise in popularity of ETH tokens can be attributed to its use case and a huge number of Dapps on the blockchain.