
Ethereum price analysis on Sunday, May 24, shows ETH trying to recover after recent selling pressure. Buyers are still defending lower support areas. However, the token needs stronger momentum to reduce weekly losses.
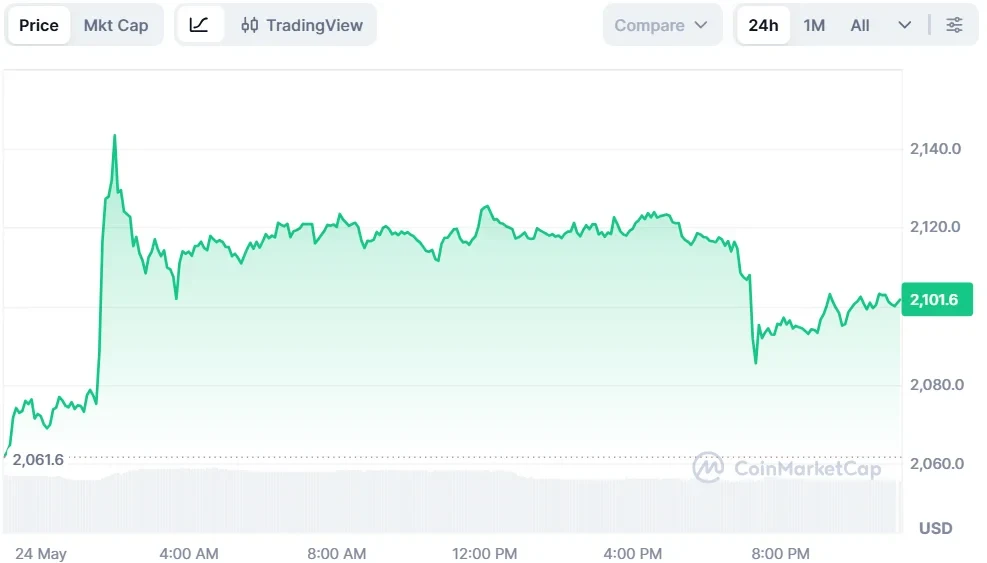
As of press time, Ethereum (ETH) is trading at $2,100 with an increase of 1.34% over the last 24 hours, according to CoinMarketCap data. Its market capitalization stood at $253.63 billion, while the token remained down 3.72% over the last seven days.
Also Read: TRX Price Prediction: Could TRX Move Upward After Institutional Accumulation?
Ethereum Support Holds as Resistance Builds
Crypto analyst TedPillows highlighted that Ethereum bounced from the $2,000 support level during the latest market move. The bounce indicated that there was activity from buyers in that area. However, ETH was unable to continue the recovery from the $2,150 resistance zone.
The next step will be determined by whether Ethereum can retake $2,150. If ETH clears the level, it may be able to surge rapidly to $2,250. The support level of $2,000 may be retested soon if the price is unable to recover from $2,150.

In addition, another analyst, The Boss, mentioned that Ethereum’s primary trend structure could still be intact despite the current market pullbacks. He stated that ETH bounced off an ascending trend region that has been in effect since 2022.
He noted that Ethereum rallied following its recent contact with the long-term trend region. This may reflect a buying defense in the general market in the short term but also a buying defense on this reaction.

The analyst further noted that ETH needs to maintain the consolidation above the rising trend area in order to secure the setup. He said the yellow lines can still be major resistance levels as long as the trend region is not broken.
Ethereum Price Analysis Points to Weak Technical Signals
According to TradingView data, the Relative Strength Index (RSI) is at 37.56, while the RSI moving average stands at 40.10. Both readings were below the neutral 50 level, indicating that sellers remained in control. Ethereum price analysis shows that RSI has not entered oversold territory.
The Moving Average Convergence Divergence (MACD) data continued to show bearish pressure. The MACD line is at -52.1, while the signal line sits at -35.9. The histogram showed -16.2, which confirmed that downside momentum is still active during the session.

Ethereum price analysis depends on whether ETH can reclaim $2,150. A breakout above it could lead to a rally to $2250. A rejection could bring another test of $2,000 level.
This article contains market analysis and price predictions. These are not guarantees. Crypto markets are volatile. Always DYOR. Not financial advice.
Also Read: BNB Price Forecast: Accumulation Phase Points Toward $5,000 Cycle Peak
