
Ethereum price analysis shows ETH under short-term pressure on Sunday as the token hovered near $2,185, on May 17, 2026. Analysts said the pullback still appeared corrective, but buyers needed to protect channel support to keep another recovery attempt alive now from this zone.
Analyst More Crypto Online highlighted that Ethereum remained weak in the near term. The analyst noted that the drop had not indicated a sell-off or bigger market top.
The main outlook depends on the support region. As long as ETH remains above the lower channel limit, the chart may be able to extend further to the upside.
Also Read: WIF Price Forecast: Falling Wedge Pattern Could Trigger a Bullish Move to $1.30
Ethereum Price Analysis Holds Focus on Key Support
Ethereum price analysis showed that the nearby support is at $2,170 and $2,122. If that area should lose further ground, then the next major support area of $2,037 may be in focus.
On the upside, ETH needs a clean break above $2,318 to improve its setup. The analyst added that the move could open the way toward the $2,646 region.

The risk case continues to be connected to the bottom channel line. If it breaks below that support, then it has a greater probability of a bigger top.
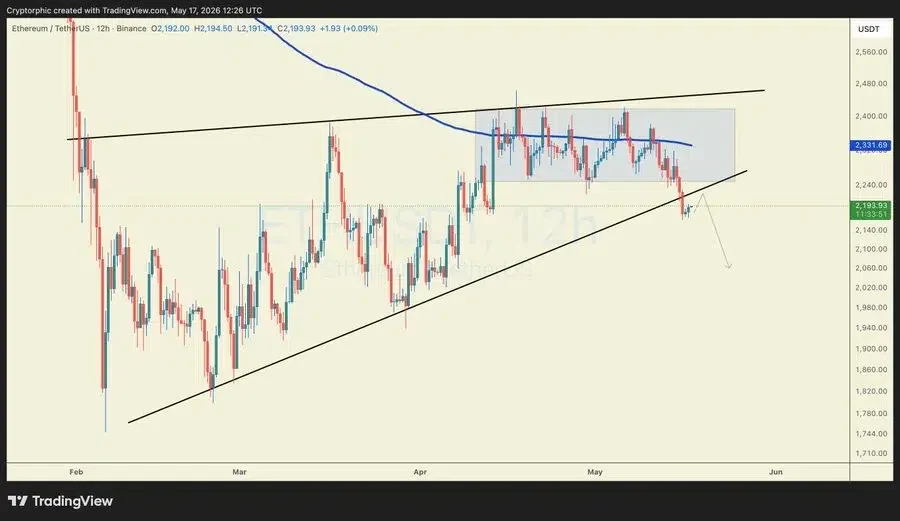
Additionally, another analyst, Cryptorphic, mentioned that the momentum has weakened due to the rejection from the upper resistance range as well. The analyst noted that the recent move below local support showed that buyers were losing strength.
The current Ethereum price analysis focuses on the upward trendline around the $2,180-$2,200 mark. However, if ETH is unable to hold this zone and breaks below it, sellers may continue to move towards lower support levels.
ETH Momentum Weakens as RSI Stays Below 50
As per TradingView data, ETH is currently hovering around $2,184.6 at the time of writing. It also showed a daily high of $2,197.60 and a daily low of $2,166.60.
The Relative Strength Index (RSI) indicated weak momentum on the daily chart. The RSI stood at 39.57, while its moving average was 49.95. This kept momentum below the neutral 50 mark and showed weak buyer control.

The Moving Average Convergence Divergence (MACD) data also supported a cautious view. The MACD line is at -20.2, and the signal line stands at -15. 8. The histogram is negative and around 4.4, indicating bearish pressure continued.
This article contains market analysis and price predictions. These are not guarantees. Crypto markets are volatile. Always DYOR. Not financial advice.
Also Read: Ethereum Price Prediction Shows Over 110% Upside Toward $4,800 Breakout Zone