
• Skip to primary navigation
  • Skip to main content
  • Skip to primary sidebar
  • Skip to footer
  • About TronWeekly
  • Write for us
  • Terms and Conditions
  • Privacy Policy
  • Disclaimer
  • Contact
  • All Posts
  • Advertise

TronWeekly

Crypto World News

  • Home
  • Latest News
  • Opinion
    • Education
    • Best TRON Wallets
    • Beginner’s guide to TRON
    • Tron Tokens
    • Market Analysis
  • Industry
    • Tron Exchange
    • Project Review
  • Press Release
  • Bitcoin (BTC)
  • Ripple (XRP)
  • Advertise
  • About TronWeekly
    • The Team
    • Editorial Policy
    • Write for us
    • Privacy Policy
    • Disclaimer
    • Terms and Conditions
    • Contact
You are here: Home / Cryptocurrency News / Ethereum Price Breakout Mirrors 2025 Pattern Above $2,300

Ethereum Price Breakout Mirrors 2025 Pattern Above $2,300

What to know:

  • Ethereum trades near $2,260 with analysts watching $2,300 for breakout confirmation
  • Short liquidations top $102 million as bullish momentum builds across key indicators
  • Weekly ETH structure mirrors April 2025 pattern that preceded a 250% rally

By Paul Adedoyin | Edited By Ammar Raza,April 9, 2026, 9:30 AM

Ethereum Price Breakout Mirrors 2025 Pattern Above $2,300

Ethereum price is forming a repeating breakout structure in April 2026, according to analysts. ETH trades near $2,260 with rising volume and momentum.

Also, there has been an increase in trading volume and bull run momentum. The current trade scenario is quite similar to April 2025, where the ETH price rallied by approximately 250% after a similar consolidation pattern.

Therefore, traders are currently waiting for confirmation of a sustainable Ethereum breakout through the $2,300 price area. Ethereum price is approaching key resistance, with technical indicators and derivatives data signaling a potential breakout continuation.

Analysts Identify Similar Patterns Of Bullish Activity

Trader Tardigrade stated that he has identified nearly identical pre-breakout formations after analyzing higher timeframes. He reported that the same three-day consolidation pattern that was seen last year is now visible on the weekly timeframe.

The structure that is observed displays a consolidation-expansion cycle, which historically has led to a rapid price rise. This may indicate a similar Ethereum breakout outcome.

$ETH#Ethereum broke out of its base in April 2025 and ripped 250%.
This April, ETH just pulled the same breakout again.

❇️ Even the pre-bottom structure looks nearly identical: last year it played out on the 3-day chart, this time it’s showing up on the weekly.

Bullish 🚀 pic.twitter.com/EWqeRiB0rX

— Trader Tardigrade 🧬 (@TATrader_Alan) April 8, 2026

CyrilXBT stated that Ethereum is currently testing the resistance zone between $2,250 and $2,400. Multiple rallies have been rejected by this area since February. He added that the 200 EMA, located above $2,690, is acting as macro-resistance.

A weekly closing price above $2,300 would indicate a trend change.
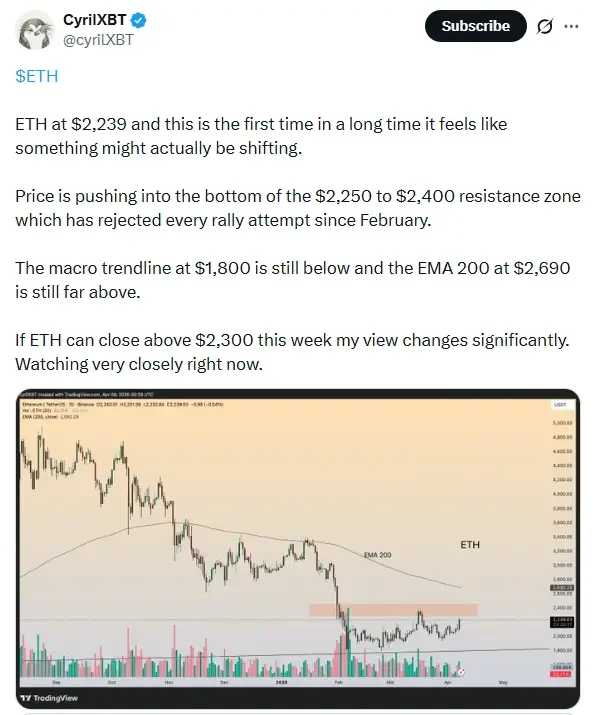
Ethereum price tests resistance near $2300 as analyst CyrilXBT highlights key breakout level
Source: X

Also Read | Ethereum Breaks $2,200 Resistance as Short-Term Bullish Momentum Gains Strength

A Momentum Shift is Identified

Data from TradingView demonstrates bullish momentum building in key technical areas. TradingView data illustrates that the 20 EMA is currently crossing above the 50 EMA, indicating that short-term momentum is improving.

Additionally, price is currently above both of these moving averages, illustrating early-stage trend alignment. Although the 200 EMA remains above the current ETH price.

This indicates that macro-resistance is still present. However, historical examples demonstrate that pressure is normally built up prior to a breakout expansion.

The RSI is near the value of 62, indicating that buying pressure is increasing due to decreasing selling pressure, without entering into overbought territory. This provides additional support to continue to expect higher prices.

The MACD has turned bullish as indicated by the signal line transitioning upwards and the histogram becoming positive. This represents a transition from bearish to bullish momentum.

Trading volume is increasing and suggests trader participation in the Ethereum breakout.
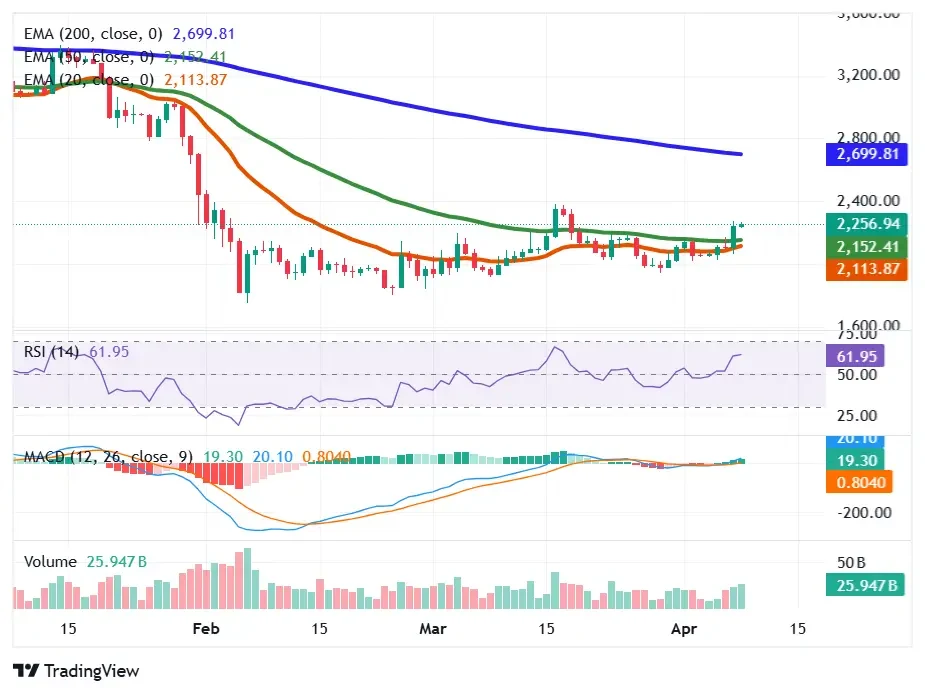
Ethereum price shows EMA crossover RSI strength and MACD bullish momentum on TradingView chart
Source: TradingView

A Short Liquidation Pressure

CoinGlass data shows that over $121 million worth of Ethereum liquidations took place within 24 hours. The majority of these liquidations were attributed to short sellers who were forced to exit their positions as the price rose. These types of events typically lead to strengthened bull runs.

Additional data from CoinGlass shows that derivatives volume increased by over 34% to $66 billion while open interest increased by 15%. Both of these metrics illustrate new capital entering the market and providing additional support to the current breakout structure.
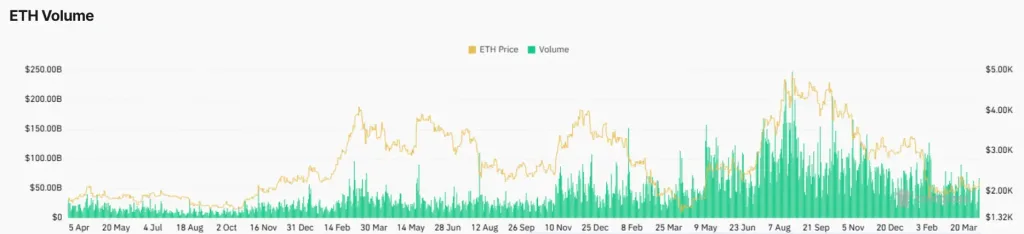
Ethereum derivatives volume and open interest rise signaling strong participation during breakout attempt
Source: CoinGlass

Ethereum Price Prediction

Currently, the Ethereum price is trading below its long-term resistance zone but continues to exhibit increasing structural support. Bullish continuation signals are currently evident in both technical indicators and derivative data.

If Ethereum breaks out of the $2,300 resistance level, then additional upside breakouts can be anticipated. If this does occur, there can either be continued uptrends or a correction towards $2,100.

This article contains market analysis and price predictions. These are not guarantees. Crypto markets are volatile. Always DYOR. Not financial advice.

Also Read | Ethereum Leads 47% Boom As Aggregators Unlock Smarter Trading Routes: Report

Filed Under: Cryptocurrency News, Altcoin News, Ethereum (ETH)

About Paul Adedoyin

Paul Adedoyin is a Financial Correspondent at Tronweekly with over four years of experience covering the cryptocurrency and digital asset sector. His work focuses on Bitcoin, altcoins, and DeFi, alongside crypto regulation and policy, blockchain technology, Web3, Layer 2 ecosystems, and AI-blockchain developments. He verifies reporting through primary sources such as official filings, regulatory statements, court records, and on-chain data to ensure accurate, fact-based coverage. His work has been featured on platforms like U.Today and CryptoMode.

Twitter

Primary Sidebar

Recent Posts

  • NEAR Protocol (NEAR) Price Breakout Signals Trend Reversal Toward $3.42 Zone May 24, 2026
  • EURR and USDR Crash Following Ongoing $2.8 Million StablR Exploit May 24, 2026
  • STABLR Exploit Triggers USDR and EURR Depeg Sparks $10 Million Market Panic May 24, 2026
  • Solana Price at Key Make-or-Break Zone as Bulls Defend Downtrend Retest May 24, 2026
  • ATS Price Prediction: Bullish Rebound Signals Potential Rally Toward $0.43 May 24, 2026

Footer

News

  • Latest News
  • Altcoin News
  • Bitcoin (BTC)
  • Blockchain
  • Tron (TRX)
  • World

Digest

  • Meet the Founder
  • Price Winning Article
  • DeFi
  • Cyber Security
  • Crypto Scam

Industry

  • Project Review
  • Technology
  • Fintech
  • Tron Exchange
  • New in Town

Tron Universe

  • Event and Tron Parties
  • New in Town
  • Tron Tokens

FOLLOW US

  • Facebook
  • Telegram
  • Twitter
  • Linkedin

Editorial Policy | Privacy Policy | Disclaimer | Terms and Conditions | Masthead

Copyright © 2026 · Tron Weekly. All Rights Reserved. NOTE: Tron Weekly is an independent crypto news site that adheres to the strict journalism policy anchored on transparency, trust, and objectivity, we have no affiliation with the TRON Foundation, its founder Justin Sun or any other cryptocurrency firm.