
Ethereum price is holding above an important support level, with buyers trying to prevent ETH from entering a further correction. Although Ethereum has managed to post a small daily gain, technical indicators suggest that the recent bounce is running out of steam.
At the time of writing, ETH is trading at $1,861.67, up 0.55% over the last 24 hours. Ethereum has recorded $21.41 billion in daily trading volume and holds a market capitalization of $225.24 billion, showing that investor interest remains active despite recent price swings.
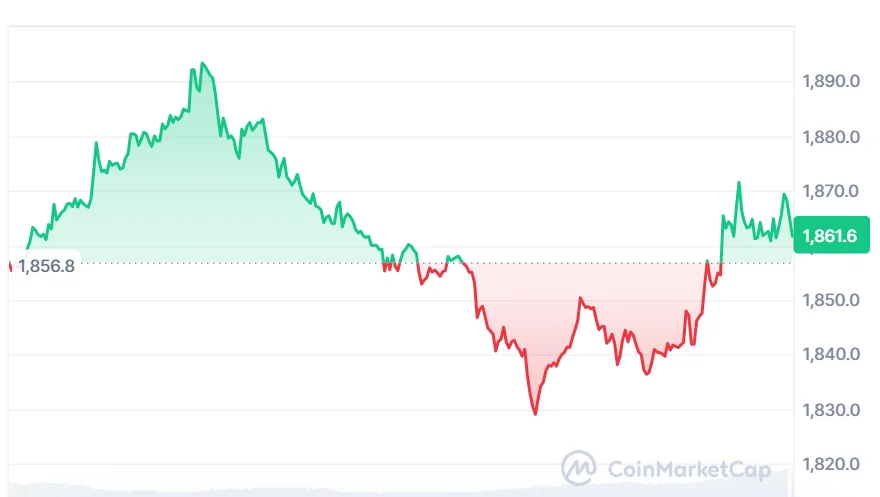
Ethereum Price Faces Crucial Support Zone
The crypto analyst Ted stated on August 3, 2026, that Ethereum price has been currently challenging an important support range from $1,800 to $1,850. Ted believes that the support region can be a deciding factor for the future moves of ETH.
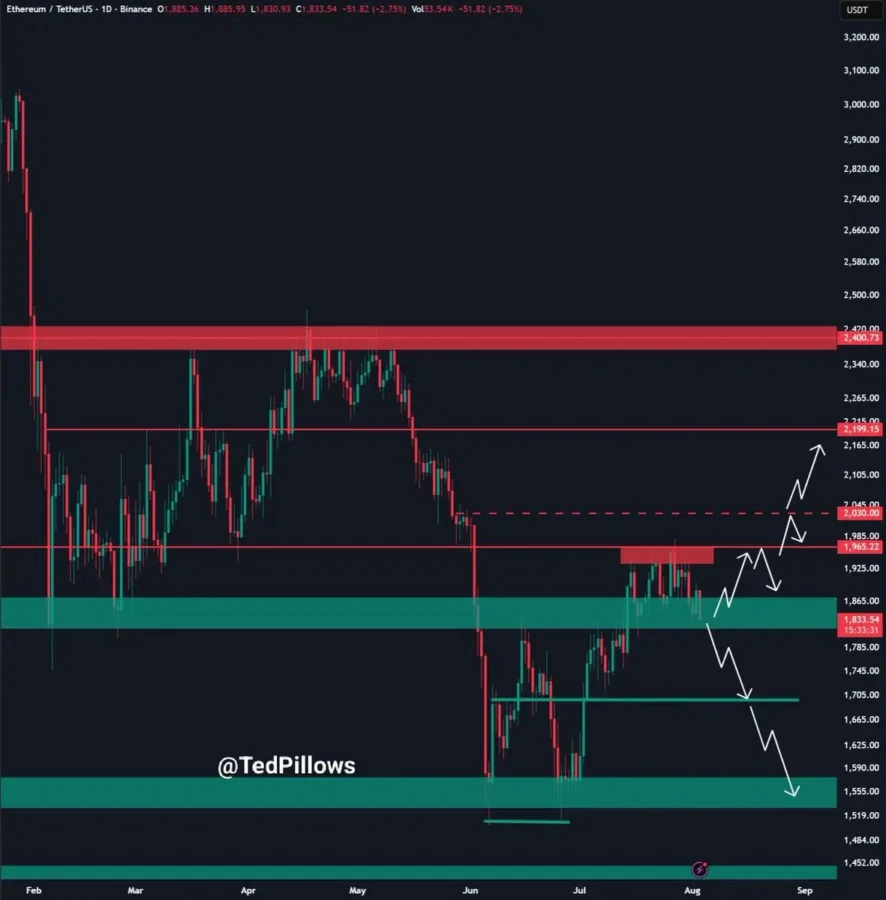
If ETH manages to hold above this support range, the buyers could make an effort to challenge the next resistance levels. On the other hand, a strong breakout below support can raise the probability of a fall of ETH towards $1,700.
Support areas can become significant during times of uncertainty, since it will be where previous buyers have entered the market. When this support area is lost, more selling pressure could occur from short-term players.
Also Read | SpaceX Stock Drops 52% From Peak as Post-IPO Correction Deepens
Long-Term Ethereum Holder Sells After Years of Inactivity
In addition to increased interest in the market, Lookonchain has noted that an early Ethereum owner started trading again after almost three years of silence.
Specifically, the account sold 2,250 ETH for about $4.15 million after not making any transactions for several years. As per the on-chain data, the investor bought Ethereum over 8 years ago for roughly $489 per ETH.
Even after the recent sale, the investor made substantial gains relative to their initial investment cost.
Big movements out of long-dormant addresses tend to raise eyebrows because they add to short-term sell pressure and may even impact market sentiment. Yet, one trade alone does not always indicate a bigger picture trend.
Technical Indicators Show Buying Strength Is Slowing
The technical indicators of Ethereum show that the bullish trend is losing steam.
The Relative Strength Index (RSI) is at 51.05, whereas its moving average is at 56.59. Although RSI is just above the 50 mark, it has moved below its signal line. This means the strength of buyers is declining even though there has been no change in the bearish trend.
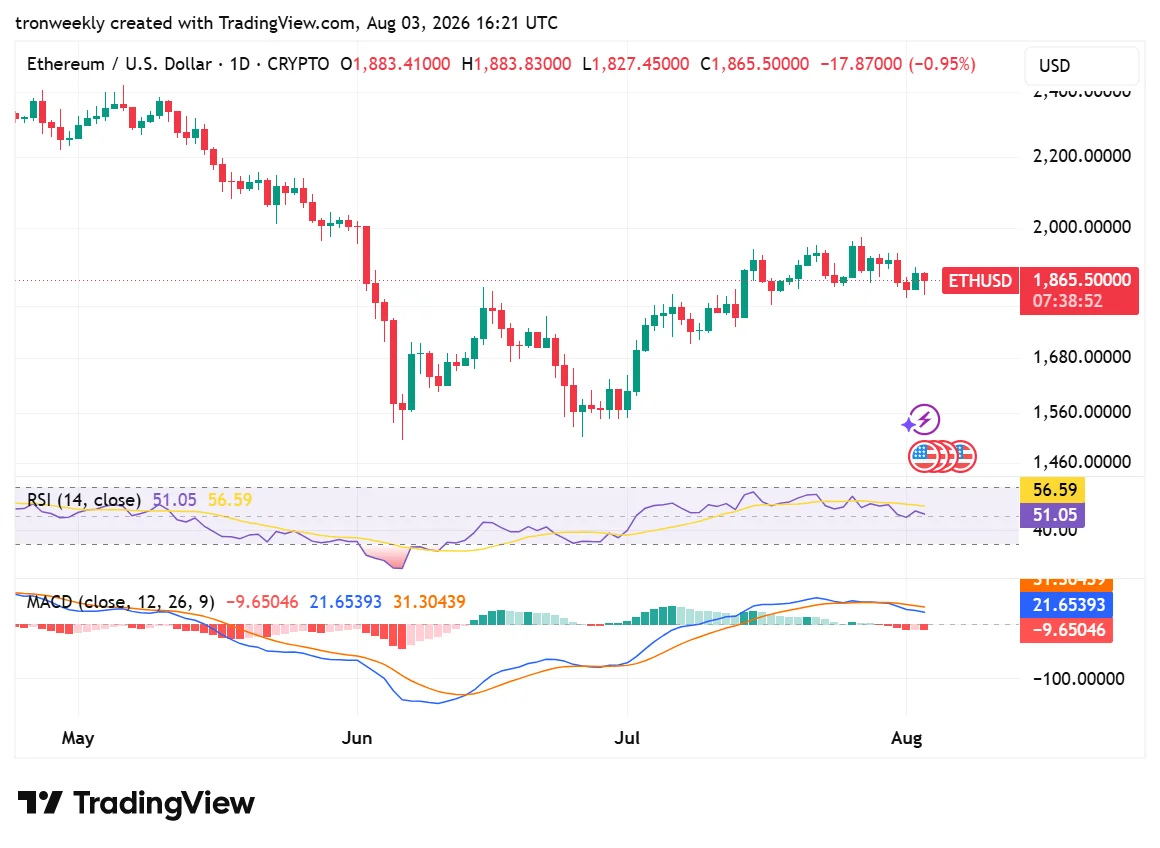
However, the Moving Average Convergence Divergence (MACD) indicator also indicates a slowdown in the upward trend. The MACD is currently at 21.65, which is below the signal line of 31.30; also, the histogram has reduced to -9.65.
The bearish crossover suggests that the pressure on the selling side has increased. If buying pressure does not increase, the cryptocurrency will trade sideways or fall in the coming days.
What’s Next for Ethereum Price?
The coming sessions will play a big role in setting the near-term path for Ethereum. On the buyers’ side, it is anticipated that the $1,800 support region will be defended, while the sellers will try to break it.
It should also be noted that investors will keep an eye on on-chain flows from long-term holders and whales.
If Ethereum stays above the support level and the buying volumes increase, there will be chances of Ethereum recovering. If the selling volume continues to rise along with the poor technicals, then there are chances that Ethereum might fall to $1,700.
Also Read | TRON (TRX) Price Eyes Breakout to $0.37 as Tron Inc. Expands Token Treasury
This article contains market analysis and price predictions. These are not guarantees. Crypto markets are volatile. Always DYOR. Not financial advice.