
Ethereum price currently finds support at $2,700, having rebounded from its daily lows at $2,635, although constant selling pressure below the resistance region remains in question.
Table of Contents
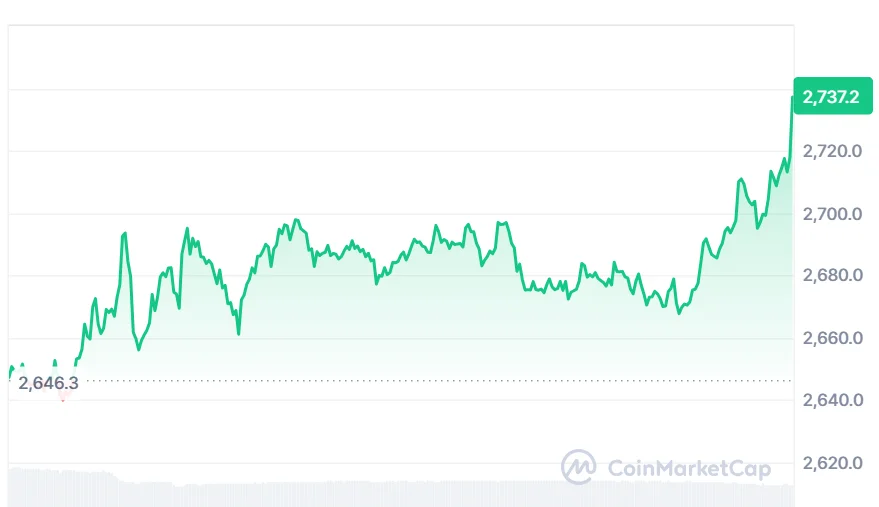
At the time of writing, Ethereum is trading at $2,737.02, with a 24-hour trading volume of $23.21 billion and a market capitalization of $330.74 billion. ETH has gained 3.36% over the last 24 hours.
Ethereum Price Struggles Near Resistance
On September 25, Crypto analyst Ella pointed out that Ethereum has been denied access to this region time and again. The Ethereum price declined to $2,635 and bounced back, but the recovery rally saw another sell-off near $2,700.
As per the technical scenario outlined by Ella, there are two key levels at play. The Ethereum price needs to stay above its rising support trend line and close above $2,705. This will provide an opportunity for the focus to be on the $2,720-$2,725 area.
On the contrary, any breakdown below $2,635 might make the current rebound pattern lose its strength and make the probability of a further drop higher.
Also Read | LINK Price Eyes Breakout Toward $15 as Network Activity Signals Momentum
ETH Price Technical Indicators Point to Further Upside
In the context of the overall technical setup, the situation is positive for Ethereum since the price is trading above the moving averages.
According to the technical indicators provided above, the 20-day SMA of ETH is $2,559.02, while the 50-day SMA is $2,357.03. The 100-day SMA is $2,073.60, while the 200-day SMA is $2,094.48.
Nevertheless, just the appearance of the moving averages is not enough for confirmation of yet another breakout. There is a need for further movement of ETH through the resistance levels and sustaining those levels.
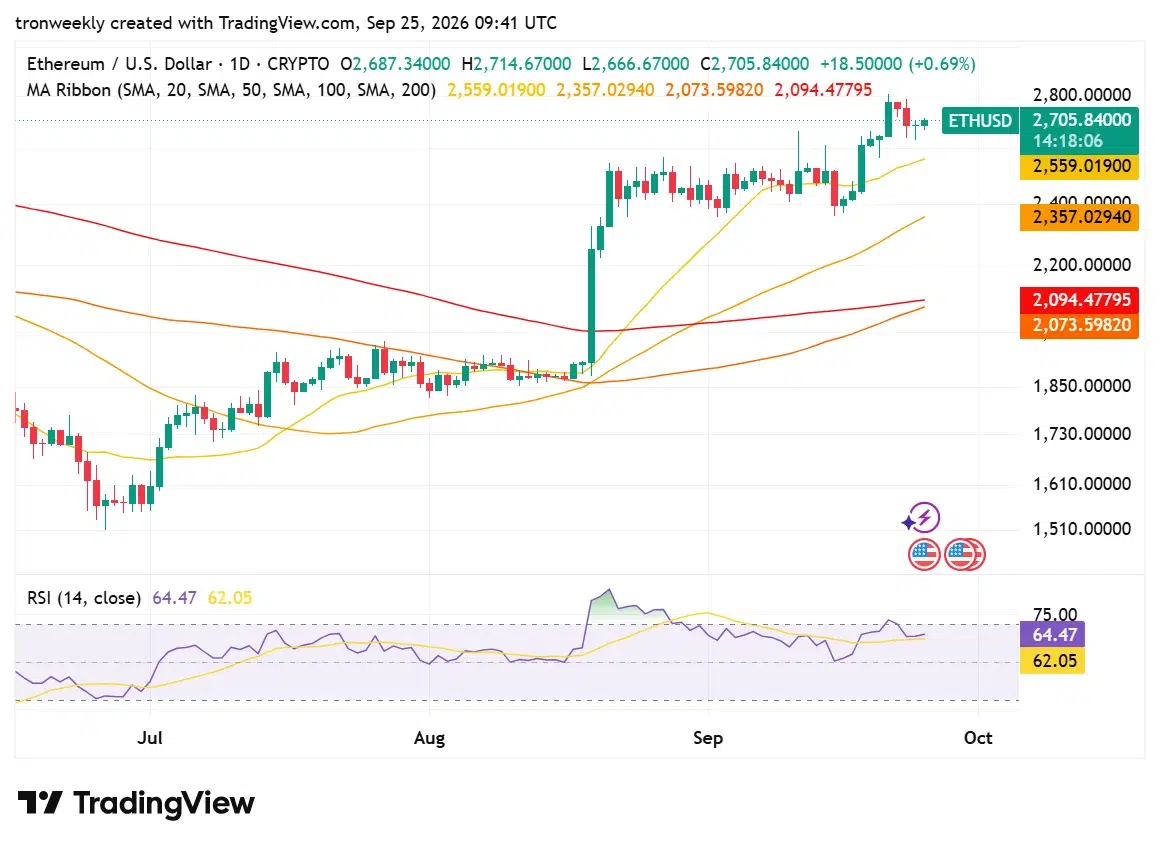
The same applies to the Relative Strength Index. The Ethereum RSI stands at 64.47, and the signal line stands at 62.05. The Relative Strength Index is below the standard overbought zone of 70.
A further rise of the RSI index above the resistance zones would be positive. On the other hand, a fast fall of the RSI index will show momentum weakness.
Ethereum Price Eyes Breakout on Fibonacci Setup
The other analyst, BATMAN, has mentioned the Fibonacci extension level 1.618 as one of the levels that are still important for the Ethereum formation.
This Fibonacci formation makes the price action even more interesting, since ETH is moving towards the area where the price action before has created resistance.
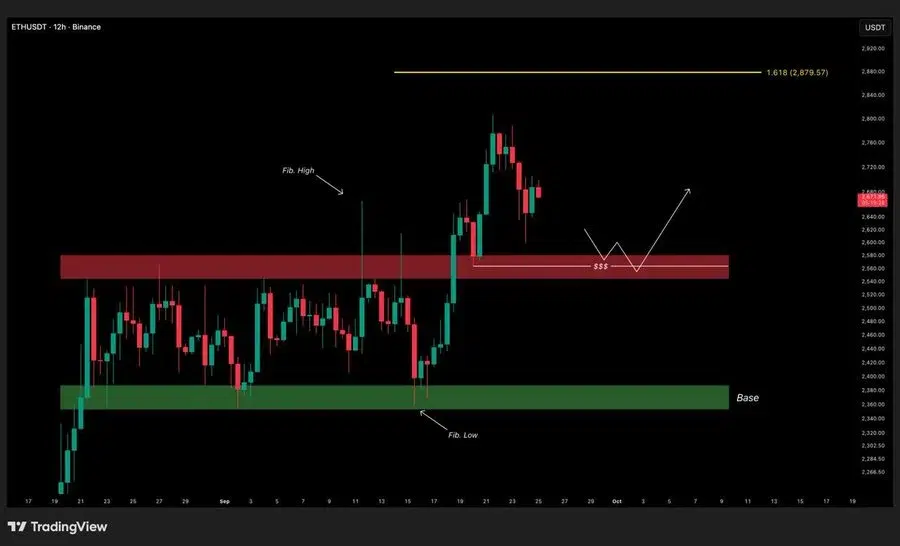
What is currently important is the ability of Ethereum to convert the $2,700 level from resistance to support. If that happens, then the next level to be monitored would be the $2,720-$2,725 range, according to Ella.
In case ETH drops to $2,635, the bounce could encounter further challenges.
This makes the current struggle for $2,700 even more important, with the upside move potentially helping ETH approach the next resistance area, while the downside move would shift focus to the lower levels of support.
What Comes Next for Ethereum Price?
Decision time is coming soon for Ethereum. Meanwhile, $2,635 continues to serve as key short-term support from the current pattern. Breaking below it will weaken the bounce and potentially redirect focus to the lower supports.
The key thing to note here is the fact that a breakout has not been confirmed yet by Ethereum. ETH continues trading above its key moving averages and is being driven by positive momentum, but the bulls still have to overcome the constant selling pressure near $2,700-$2,705.
At the moment, the next clear move either above resistance or below support is required to determine Ethereum’s short-term direction.
Also Read | QNT Price Eyes $130 Breakout as Quant Network Development Adds Momentum
This article contains market analysis and price predictions. These are not guarantees. Crypto markets are volatile. Always DYOR. Not financial advice.