
- FET is trading at $0.6481 with modest daily gains.
- Buyers are defending a strong demand zone between $0.596 and $0.549.
- Resistance levels at $0.75 and $0.87 remain challenging.
- RSI, MACD, and OI show cautious but improving sentiment.
Artificial Superintelligence Alliance (FET) has displayed resilience in the current market, maintaining a modest daily increase despite a negative weekly performance. Over the last 24 hours, the token gained 1.03%, yet it is still down 3.44% for the week.
At press time, FET is trading at $0.6481 with a 24-hour trading volume of $73.01 million, reflecting a 6.53% increase. Its market capitalization stands at $1.54 billion, which reflects continued investor interest.

The FET is consolidating near a strong demand zone. Buyers continue to step in between $0.596 and $0.549, preventing deeper declines. This zone has held firm recently, indicating accumulation and potential preparation for a breakout.
FET Resistance Levels and Key Bullish Targets
According to crypto analyst @p4coNQ, the immediate resistance lies between $0.71 and $0.75, where previous rallies have faced profit-taking. A breakout above this region could open the path toward $0.83–$0.87, a historically significant reversal area.
Beyond that, the next bullish checkpoint is $0.95, with the larger target projected near $1.00. Reaching this level would represent an upside potential of around 54% from the current price.

On the downside, maintaining support above $0.596 remains vital. A drop below this level would expose the token to $0.549. A failure to hold this support could invalidate the bullish outlook and push the price closer to $0.50.
Also Read: FET Price Prediction: Symmetrical Triangle Signals Breakout Toward $1.60 Target
RSI and MACD Indicate Cautious Market Momentum
The Relative Strength Index (RSI 14) currently reads 44.44, with the signal line at 45.83. Both values sit below the neutral 50 mark, keeping momentum in a neutral-to-bearish range. This highlights weak buying pressure, since repeated attempts to enter bullish territory have failed.
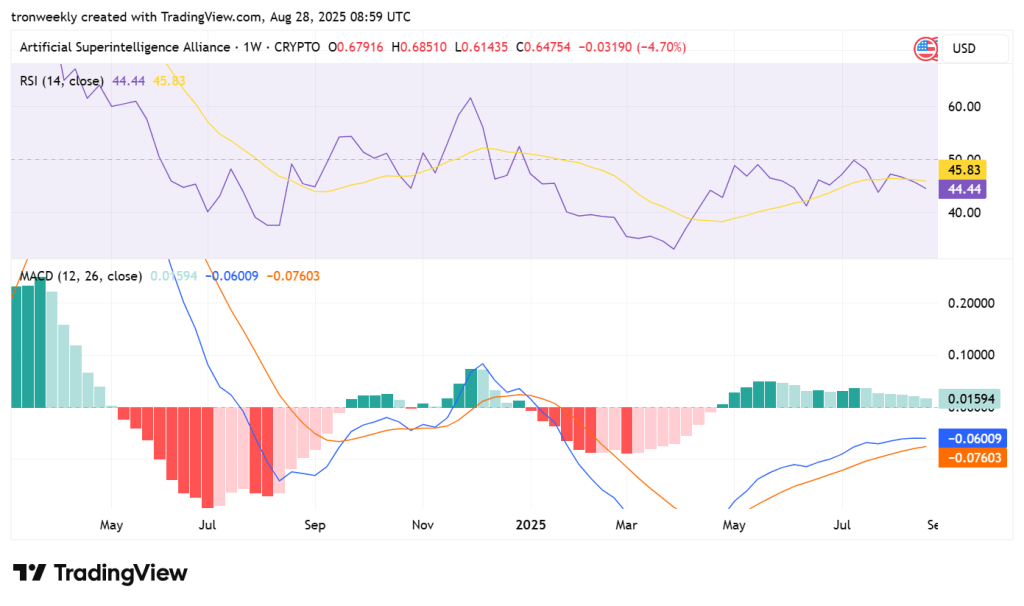
The Moving Average Convergence Divergence (12,26, close) reveals the MACD line at -0.06009 while the signal line is at -0.07603. The histogram is moderately positive at 0.01594, which means bearish momentum is dissipating. A bullish crossover is a potential result if buying action gains some traction since momentum is not strong at this moment.
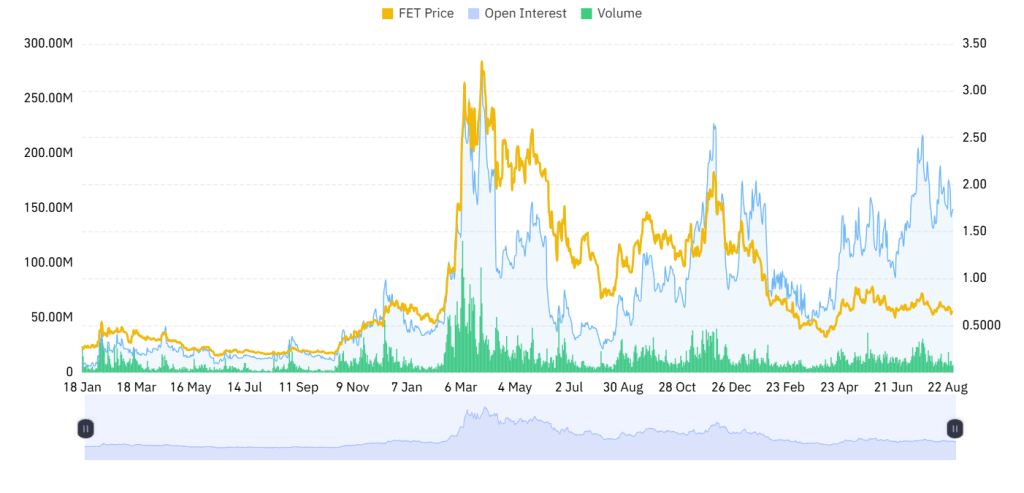
Open Interest Data Indicates Growing Participation
The open interest rose 2.97% to $151.49 million due to increased trader action and a position leveraging up. This rise is an indication of subdued accumulation or indecision in the market, coupled with relatively stable prices.
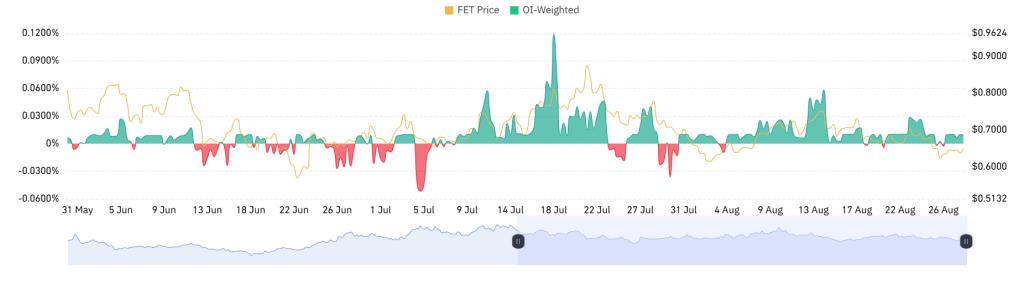
The OI-weighted funding rate is 0.0089%, which shows a mild bullish bias. Long positions are greater in number compared to shorts at this moment, though the rate is still around a neutral level, which implies a balanced state in the market.
Also Read: Fetch.ai (FET) Breaks Out of Slump, Sets Sights on $2.00 Zone