
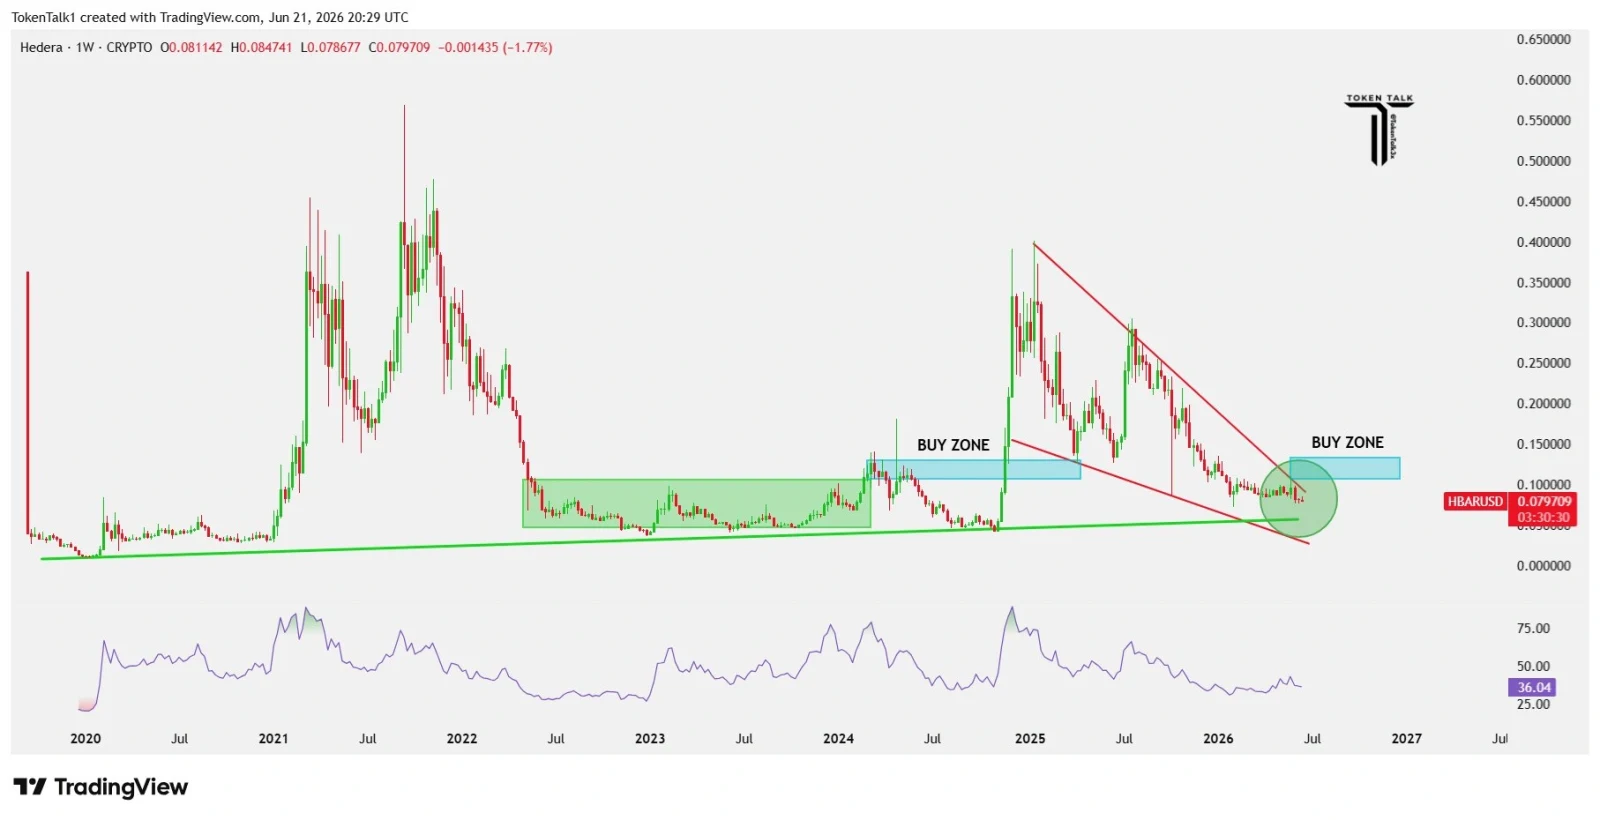
The HBAR price is once again approaching a major technical turning point, according to Token Talk, which noted that the asset is pressing into a multi-year support region. The weekly chart shows price moving into a rising trendline that has been respected since 2020.
Each major downturn in previous cycles has found buyers near this line, helping preserve the broader long-term structure despite heavy volatility. Following the major gains that the HBAR price registered in 2021, it entered an extended correction period where most of the gains were erased.
In this correction period, there were signs that the HBAR price was developing a falling wedge pattern, which indicated that the moves were becoming tighter and the volatility lower.
The RSI had fallen into the mid-30s region, a level where there has been a history of signals for a possible recovery in the past.
Source: X
HBAR Price Structure Analysis Key Buy Zone at $0.10–$0.13
Market structure analysis reveals a favorable buying range between $0.10 and $0.13. There are various technical indicators that match in this range.
These include the breakout retest range, support zone from history, and the bottom of the long-term trend. The buying range is close to the previous accumulation that was made in 2022 and 2023, while the HBAR price was consolidating.
The preparation process ultimately aided in the initiation of a recovery attempt in 2024, revealing its importance in determining the trend’s future course. Assuming that the buyers will defend the current level, then HBAR may attempt a recovery back to the range of $0.18-$0.20 initially.
If it sustains above that level, then the next target would be at the $0.25-$0.30 range, which proved to be resistant previously to rally attempts. The current test is considered an important one to confirm the breakout scenario.
Bearish Wave Structure Still Pressures Short-Term Trend
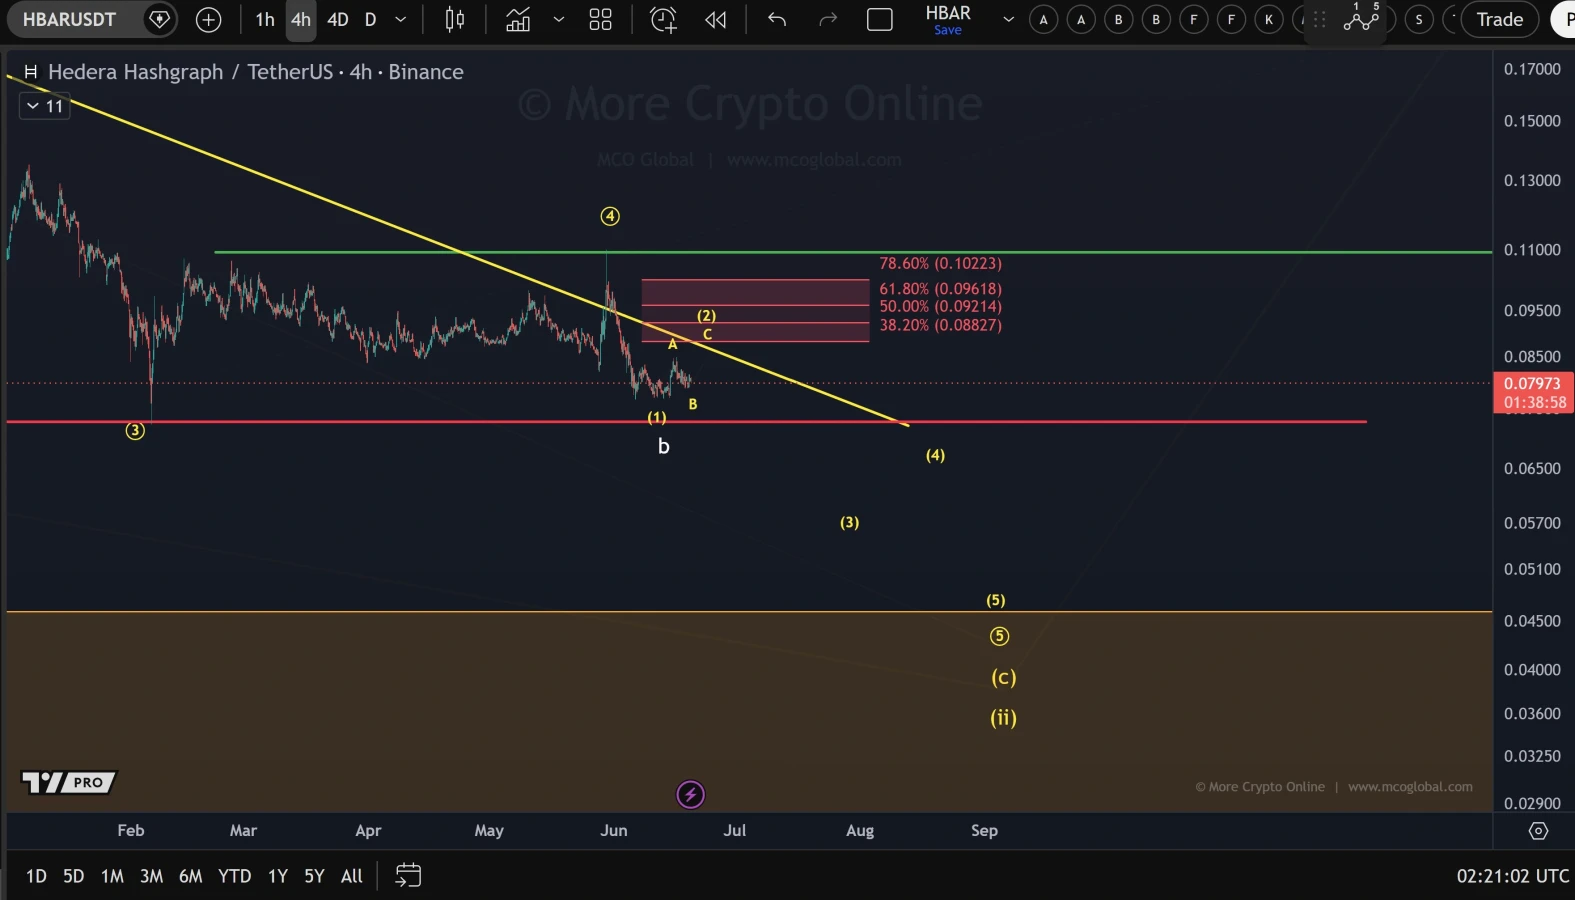
When looking at the short-time frame, however, MCO Global presents a slightly more conservative stance. They believe in a bearish Elliott Wave structure forming within the 4-hour chart.
HBAR price remains below a long-term downtrend line, which continues to push prices lower time after time. In this regard, they believe that sellers continue to be in charge.
This current wave is labeled wave (2). This wave is a rebound following an initial decline. The region between $0.088 and $0.102 is a major resistance level where progress will likely decelerate.
Source: X
Failure to break through the region and decline below $0.072-$0.073 could be a sign that the downtrend is entering wave (3), the most aggressive phase.
Under such circumstances, the bearish expectations head down towards $0.05-$0.045, which indicates greater liquidity.
The bearish outlook is still relevant unless the HBAR price goes up above $0.102-$0.11, as this will undermine the present decline and return the market to growth. Short-term pullbacks will remain corrective in nature amid the ongoing downtrend.
Also Read: XRP Ledger Strengthens Security With Common Prefix Partnership as XRP Holds Above $1.14