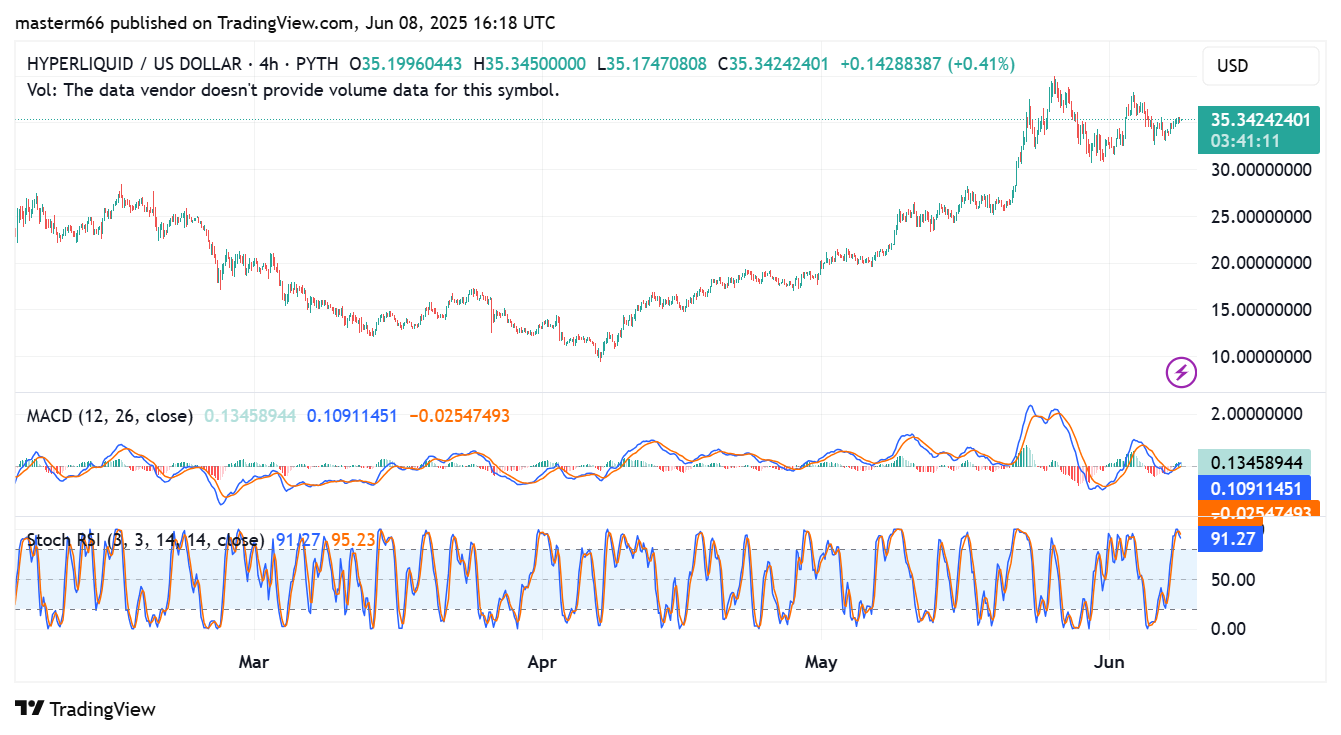
- Despite a strong jump of more than 250% from $10 earlier this year, HYPE now trades above $35.
- Although the indicators are indicating a temporary cooling, its market is still bullish.
- On-chain reports are positive, with more buy transactions than sells.
After a long, choppy climb that began in late March, HYPERLIQUID (HYPE) has now settled into a consolidation phase near recent highs. The latest 4-hour chart from TradingView hints at continued strength, though overbought signals may cool things down in the short run.
HYPE Price Stays Above $35
During the first part of the year, the asset briefly fell to $10 but has increased by more than 250% since then and reached $37 in the last week. Currently, the price is stable above $35, up by 0.41% recently.
Source: TradingView
There are two major indicators that describe the situation. MACD is showing a positive result at this time. Although the MACD surpasses the signal line, it is almost leveling off, which means the ongoing bullish run might be pausing and not slipping into a downward trend.
Viewing the histogram, it is possible to detect a slight fall that indicates the strong bull run may be slowing off for now. In contrast, the Stochastic RSI is suggesting that the price could go down.
With the RSI value above 90, the cryptocurrency is moving far into the overbought zone. Hence, a brief pullback or slow movement is possible before it attempts another upward move.
The last few months have seen the price increase in a steady bullish pattern through higher highs and lows. HYPE buyers have come in every time the price goes down, proving their continued interest.
On-Chain Data Shows That HYPE Price Could Still Rise
At this time, the price level of $35 is central to investors’ attention. If HYPE is able to keep trading above $35, it could lead to a renewed move to its previous high. If traders who seek short-term gains cash in, however, the price may dip below $34 fast.
There are positive factors in on-chain data that support the bullish view. Looking at the 90-day CVD, it is quite obvious that more buy orders are coming in than sell orders. The growing number of purchases suggest increased interest and could help the price to recover further.

Source: CryptoQuant
Related Reading | Bitcoin’s Breakout From Falling Wedge: Will It Lead to a Major Rally?