
The latest ICP price analysis shows that the token is compressing within a symmetrical triangle. This setup signals a potential breakout as traders closely monitor key resistance and support levels.
Data from TradingView and CoinGlass indicate declining volatility, often preceding strong directional moves. Market participants are now watching for confirmation as ICP approaches a critical decision zone.
According to Alpha Crypto Signal, the token price is making higher lows and lower highs within the triangular formation. Tightening ranges such as those seen here are followed by large price movements.
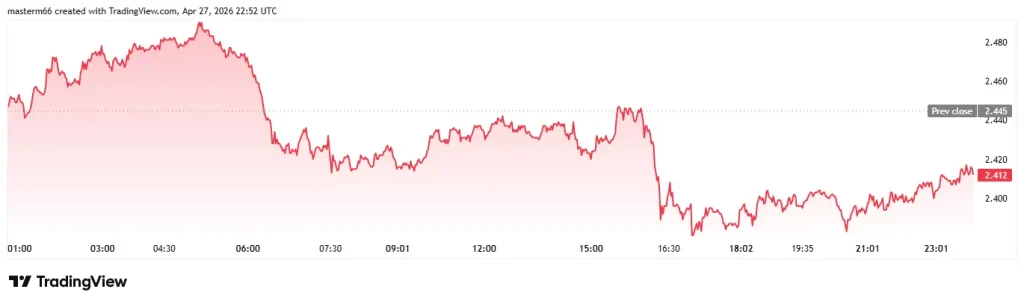
Once a price breaks out above the top of the triangle (resistance), or below the bottom of the triangle (support). Based on the TradingView data, ICP is trading at approximately $2.40, a decrease of 1.7% over the past 24 hours at press time.
Cautious sentiment is reflected in the ICP price, given that traders are waiting for additional confirmation prior to entering a position.
Symmetrical Triangles May Predict Future Moves
This ICP price analysis highlights a classic example of a symmetrical triangle formation that can be found on lower time frame charts. The symmetrical triangle represents uncertainty regarding whether the bulls or bears have control of the price.
This is because both sides are continually compressing the ICP price into a smaller area. Alpha Crypto Signal stated that if ICP breaks out above the triangle’s upper boundary, there will likely be a continuation upward toward higher prices.
If ICP breaks below its lower boundary (support), then downward pressure will likely intensify and validate the bearish ICP price prediction. Activity has remained low thus far, which reinforces anticipation of a possible “volatility squeeze” leading up to expansion.
Prior to taking action on any potential breakout signals, traders should wait for additional volume confirmation.

Also Read | ICP Shows Strong Bullish Signals as Price Eyes $10–$12 Recovery Zone
Increased Participation Among Traders
CoinGlass reported that the total number of contracts traded was significantly greater than the last day’s total, increasing by 140.71% to $148.34 million. Additionally, open interest increased by 17.31% to $86.52 million, indicating that overall market involvement is rising.
Binance’s Long/Short Ratio continues to exceed 1.3, suggesting that a slight bullish bias exists among traders relative to their current positions. Further validation of a cautiously optimistic outlook for the ICP price prediction can be found in the top traders’ positions.
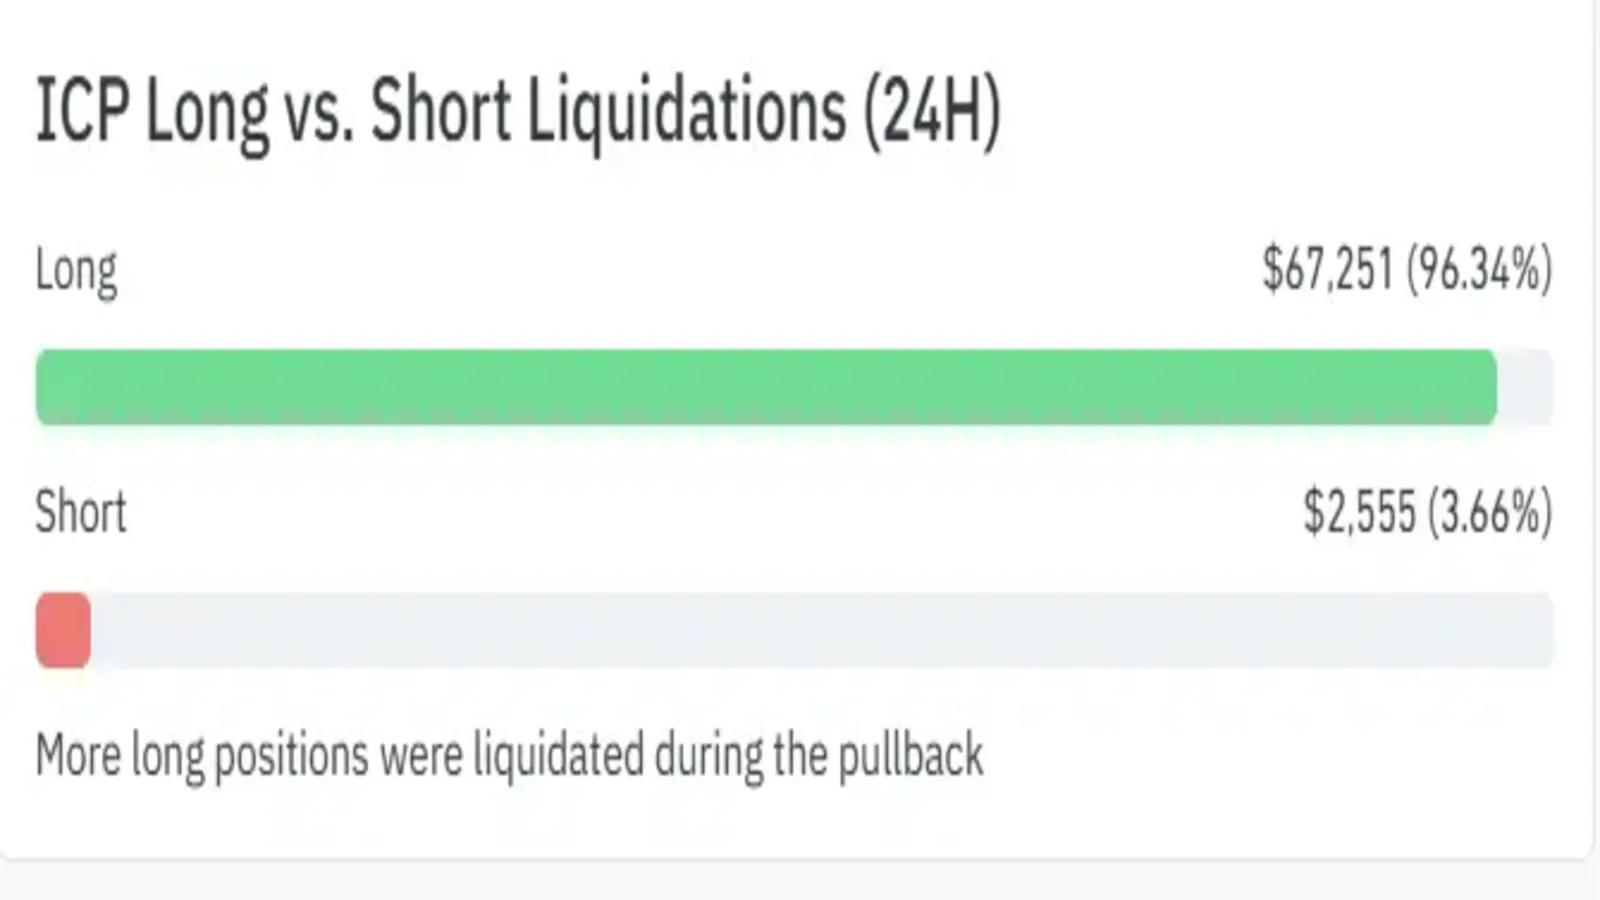
Data indicates a mix of positions being liquidated. Approximately $70,000+ in positions were liquidated, while 96% of those liquidations were attributed to long positions.
Therefore, it would appear that weak hands continue to get flushed during periods of short-term volatility within the consolidating range.
Technical Indicators Continue To Reflect Sideways Structure
The three major Exponential Moving Averages (EMAs) (the 20-day EMA, 50-day EMA, and 200-day EMA) all remain close together and indicate no dominant trend. On the TradingView 4-hour chart, ICP is currently trading just under each of its key average lines, indicating mild bearish pressure.
Relative Strength Index (RSI) stands at approximately 41. Therefore, there is no extreme momentum, but no oversell either.
Moving Average Convergence Divergence (MACD) is flat and provides additional confirmation of the sideways structure that continues to develop. Resistance levels identified via Fibonacci levels stand at approximately $2.53, and support levels are estimated at approximately $2.38. A breakout at or above those will help establish which direction is next.

Analyst’s Insight and Market Environment
Symmetrical triangles have historically shown strong directionality when they follow extended periods of range trading activity (consolidation). This ICP price analysis has followed prior symmetrical triangle breakout patterns.
Historically, once prices have expanded through previous contraction phases, volatility tends to increase again. There is considerable interest from traders in the event of an upward or downward spike in volume. This is in order for them to use the information to determine if they want to put their money into action.
This article contains market analysis and price predictions. These are not guarantees. Crypto markets are volatile. Always DYOR. Not financial advice.
Also Read | Internet Computer (ICP) Eyes 300% Potential After Falling Wedge Breakout