
JasmyCoin (JASMY) has seen a strong surge in activity after breaking above the key $0.006 resistance level. JASMY price rallied almost 30%, prompting experts to target the next resistance zones near $0.0086 and $0.0099. Technical indicators also support the bullish outlook, as the token moved above major moving averages. According to CoinMarketCap, JASMY is trading at $0.007213 with a 24-hour gain of 11.5%.

Source: CoinMarketCap
JASMY Derivative Data Support Bullish Outlook
According to Coinglass, the JASMY open interest has expanded by 20.97%, reaching $32.44 million. This rise reflects increasing leverage exposure and new positions entering the market. It signals growing trader confidence and potential continuation of trend momentum, as derivatives activity strengthens alongside broader market engagement and liquidity inflows.
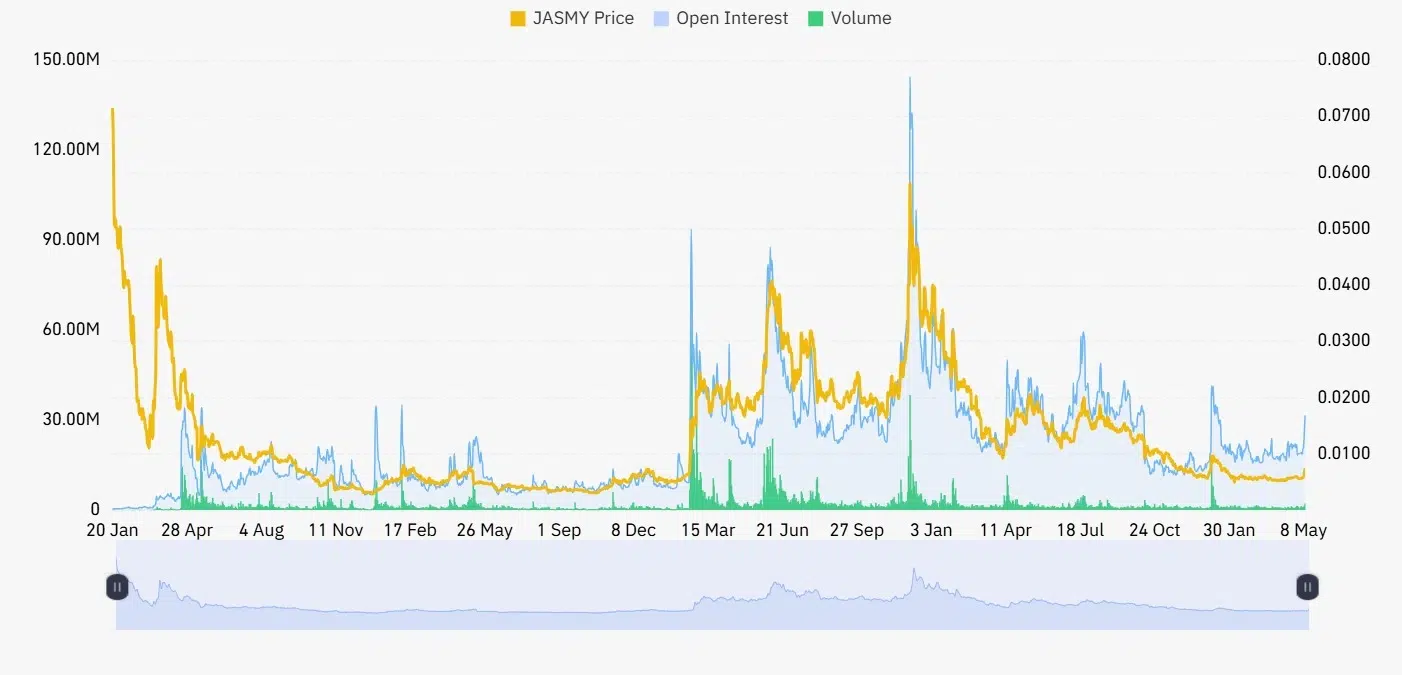
Source: Coinglass
Trading activity has also surged significantly, with volume rising by 172.78% to reach $146.47 million. This sharp increase indicates heightened market participation, suggesting strong speculative interest and renewed momentum as traders aggressively position themselves amid growing volatility and short-term price action across markets.
Also Read: JASMY Price Prediction: Rising Bullish Momentum Hints at Potential 3x Surge
JASMY Price Targets $0.0099 After Breaking $0.006 Level
Furthermore, the crypto analyst Team LAMBO highlighted that the JASMY price rallied by close to 30%, breaking through the critical resistance level at $0.006, confirming a bullish breakout that had been expected for some time.
This surge brought back optimism among altcoins, with speculators moving in due to high levels of buying pressure seen within the cryptocurrency market.

Source Team LAMBO
However, there are two robust resistance levels where JASMY’s upcoming move could be determined. The first level is the daily buy wall at $0.0086, followed by the second key resistance level at $0.0099.
Breaking out of both levels would likely create another bullish surge in price, which may set up a long-term move higher.
Technical Indicators Point to Strong Bull Run
According to TradingView, the JASMY price represents a dramatic reversal of direction from sideways movement to an energetic bull run.
Following a prolonged period of sideways price action below key EMAs, a strong upsurge in buying pressure in May lifted the price. The uptrend took out the 20, 50, and 100-day moving averages but finds stiff resistance at the 200-day level.
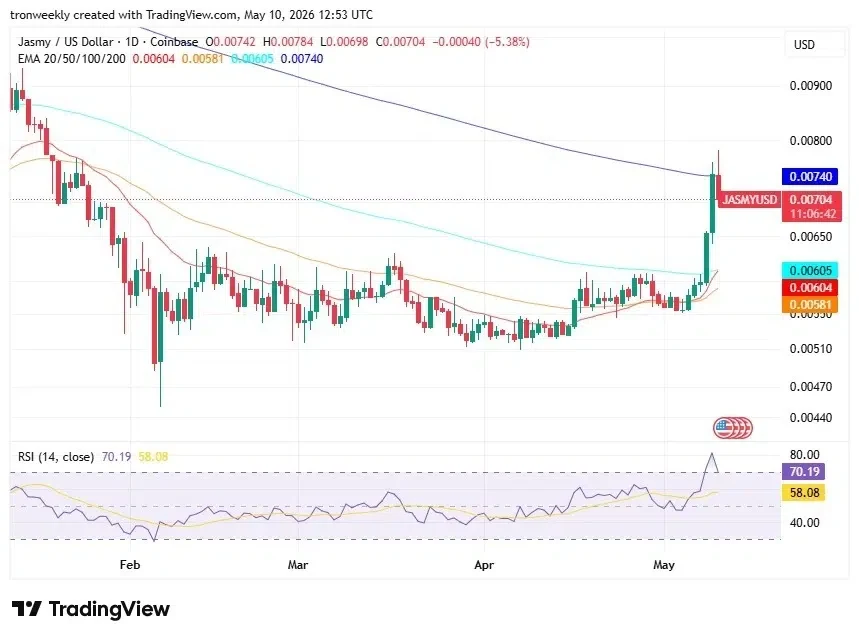
Source: TradingView
The RSI indicates the reversal, jumping out of its neutral position to reach an overbought high of 70. The strength of momentum is still strong, but the appearance of a long upper shadow on the latest candle suggests that profits might be taken soon. It will be interesting to see if the $0.0060 level holds for a potential test.
This article contains market analysis and price predictions. These are not guarantees. Crypto markets are volatile. Always DYOR. Not financial advice.
Also Read: JASMY Price Eyes Breakout: Falling Wedge Could Trigger $0.02 Rally