
LDO price is now getting some focus after a crypto market analyst pinpointed a critical accumulation zone, which might help in a long-term recovery. Improved technical indicators are also indicating bullish momentum.
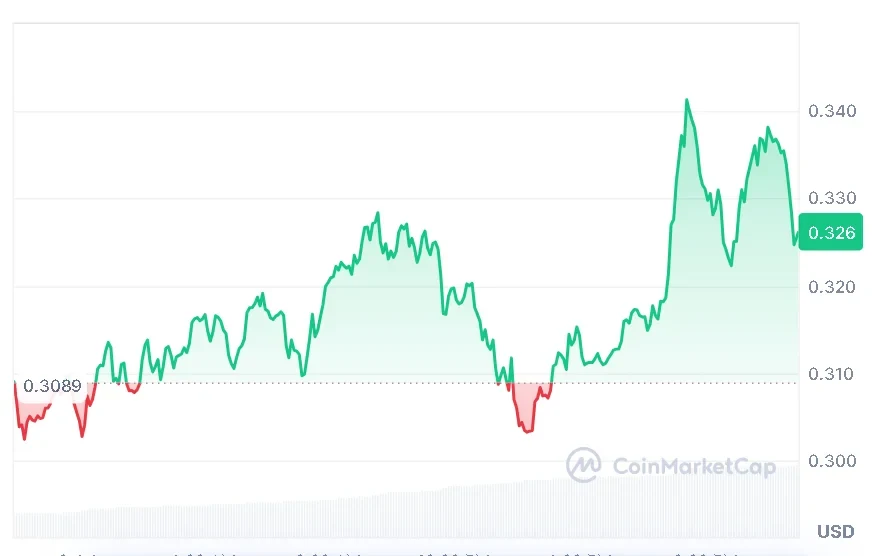
At the time of writing, LDO is trading at $0.3261, up 6.56% over the last 24 hours. Trading volume reached $235.71 million, while the market capitalization stood at $280.89 million, reflecting stronger buying activity as investors closely watch whether the token can build on its latest rebound.
Also Read | SUI Price Could Reach $0.83 if Buyers Defend Key Support
LDO Price Enters Key Long-Term Accumulation Zone
On July 8, a technical analyst, Crypto Patel, published an analysis that indicated that the LDO price is in a high-risk and high-reward accumulation phase as a result of falling about 94.2% from its previous all-time high of $4.04.
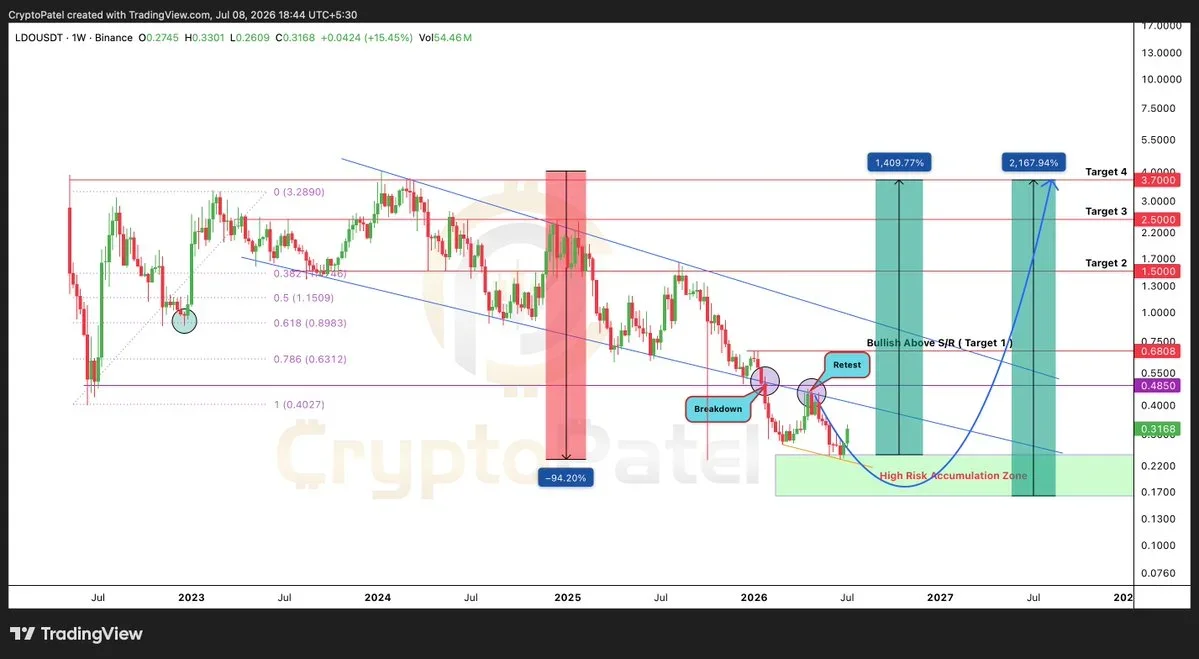
In the view of Crypto Patel, the token is currently moving within a large multi-year buying region, which investors have earlier been seen taking action in. Despite the fact that the overall trend is bearish in nature, according to Patel, this region may form the base for the coming recovery.
The Patel said the first important confirmation will happen on the week ending higher than $0.68, thus indicating that buyers are back in charge. On breaking above $1.50, confirmation will be provided for the change in market structure.
Provided the resistance levels can be broken through, then according to Patel, the coin may potentially move towards $2.50 and $3.70 when the next bull cycle begins. On the other hand, he pointed out that failure to break above the existing demand area would mean no change in the bearish pattern.
Technical Indicators Support Recent Momentum
Short-term indicators are beginning to align with the improving price action. The LDO price is trading beyond the middle Bollinger Band of 0.26622, with the current price being 0.3261, which is near the upper band of 0.31139. There is a clear upward breakout from the upper band that suggests buying interest and increasing momentum. The lower Bollinger Band is at 0.22105.

The MACD is providing a bullish signal where the MACD line is crossing above the signal line from 0.00441 to -0.00569. Moreover, the green histogram is also rising to 0.01010, which indicates that the bullish strength is gaining momentum. This can lead LDO to make more profits going forward.
While these signs show the improvement in the market condition, most analysts have agreed on the need for a continued movement above the resistance level for confirmation of a trend reversal.
What Could Happen Next?
The coming weeks will decide whether this rally ends up forming a sustainable recovery or another short-term bounce.
The key to watch in the market will be the $0.68 resistance zone. If this resistance is broken on the weekly close, it will add strength to the bullish view of Crypto Patel and move the focus to the $1.50 resistance zone.
In case of sustained buying interest, the LDO price may start to slowly test some higher objectives within the next few months. Nevertheless, in case of an inability of the coin to defend its support area, the established long-term bearish trend will persist.
This article contains market analysis and price predictions. These are not guarantees. Crypto markets are volatile. Always DYOR. Not financial advice.
Also Read | Ondo Price Eyes Strong $0.359 Breakout After Perps Launch
