Litecoin price is coming under fresh selling pressure, with LTC trading around $59.90 after falling 2.11% in the last 24 hours.
Traders are monitoring whether the cryptocurrency can maintain its position above the $59 support zone and rebound toward $63, as technical indicators and derivatives data continue to signal market uncertainty.
Also Read: Litecoin Price Looks Set for New Momentum as LTC Marks 15 Years
Litecoin Price Approaches Crucial Support Around $59
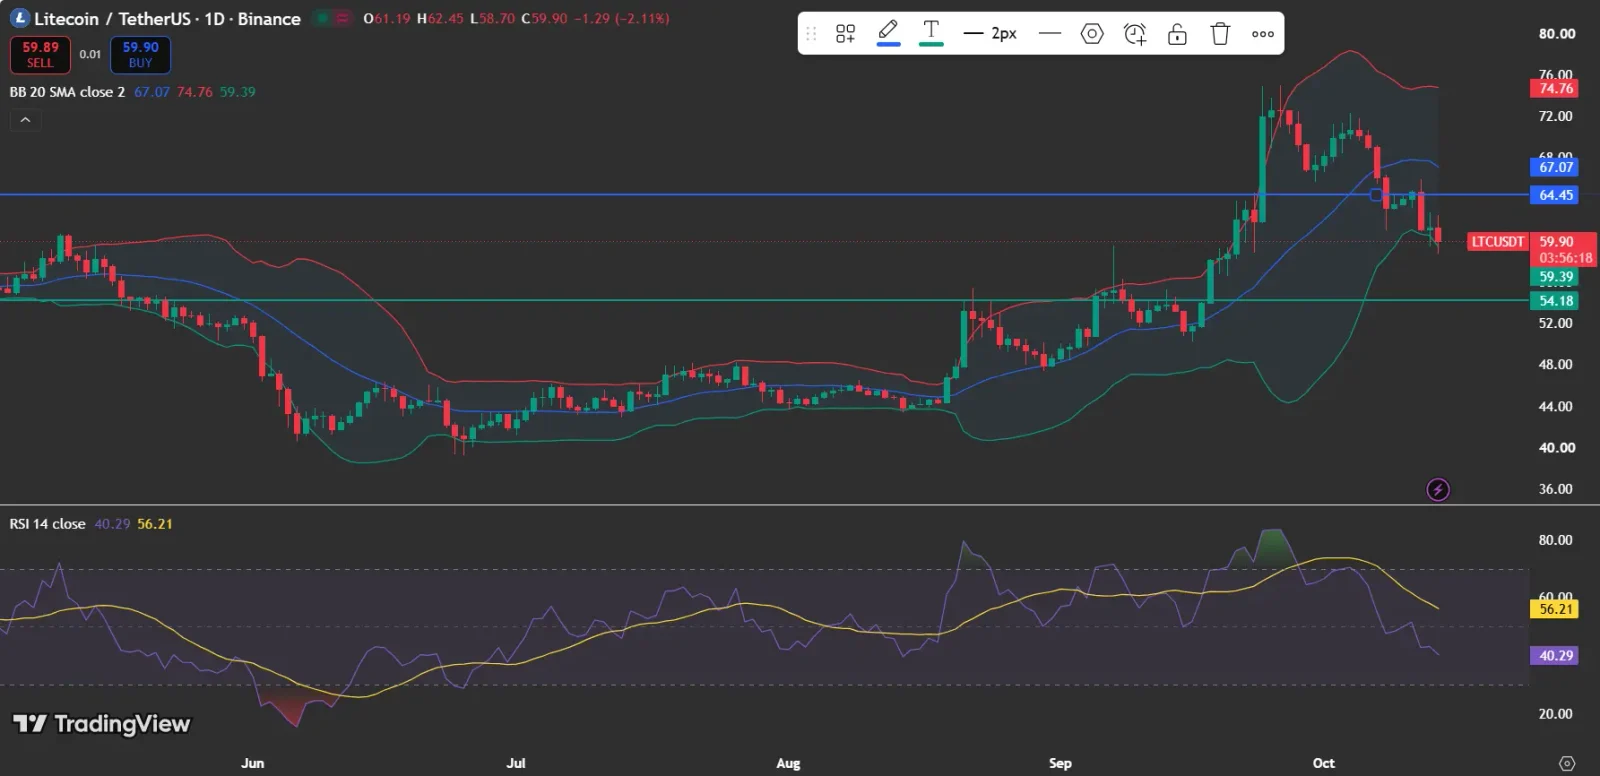
The TradingView chart indicates that Litecoin has pulled back after rising above $70 in late September. The recent drop has taken LTC beneath the $64.45 resistance level, which had previously provided support during the price’s advance.
On the daily chart, the price is trading below the 20-day Bollinger Band moving average, which stands at $67.07. The upper band is at $74.76, while the lower band is near $59.39. This places LTC close to the lower band, making the $59–$59.40 region an important area to monitor.
The $59–$59.40 range currently serves as immediate support. Holding above this zone could allow LTC to stabilize and make an attempt to recover toward $63. By contrast, a daily close below this area could bring additional downside pressure, with $54.18 becoming another significant support level.
To achieve a more substantial recovery, Litecoin would have to reclaim $63 and then challenge the $64.45 resistance. Moving above this level could create room for a rise toward the $67.07 Bollinger Band middle line.
Also Read: Litecoin Price Gains Institutional Momentum as Canton cLTC Fuels $500 Debate
Litecoin Price RSI Indicates Diminishing Bullish Momentum
The relative strength index (RSI) on the daily chart is at 40.29, below its moving average of 56.21. This indicates that buying momentum has declined after Litecoin’s September rally.
While the RSI is still above the conventional oversold level of 30, its downward trajectory shows that sellers currently hold the upper hand. A move back above 50 would offer an initial sign that bullish momentum is returning.
The Litecoin Foundation has also drawn attention to its Proof of Time initiative, which presents cryptocurrency stories from various blockchain communities.
In its X post, the foundation invited users to explore the project and share their own cryptocurrency stories. The initiative is described as “A wall of crypto stories from every chain.” Although the initiative promotes community engagement, the available information does not demonstrate a direct link between the project and LTC’s current price movement.
Also Read: Litecoin Price Eyes Breakout Toward $410 as Bullish Momentum Builds
Open Interest Drops From Its September High
According to CoinGlass data, Litecoin’s open interest rose sharply in late September, reaching about $700 million as LTC neared the $70–$72 range.
It has declined since then, reaching approximately $550 million by October 14. Litecoin’s price has weakened over the same period, indicating that speculative positioning may have cooled after the rally.
Falling prices combined with declining open interest may suggest that traders are closing positions instead of taking on new leverage. However, open interest by itself cannot determine whether long or short positions are prevailing in the market.
A fresh rise in open interest accompanied by a price recovery could indicate that participation is returning. By contrast, increasing open interest as LTC declines would merit closer examination of possible bearish positioning.
Litecoin Price and Network Activity Provide Further Context
DeFiLlama‘s dashboard screenshot tracks total value locked (TVL), active addresses, and transactions. The chart shows daily activity bars broadly around the $1 million mark on the left-hand scale, while the blue TVL line has declined from its late-September peak.
These metrics add further context to the assessment of Litecoin’s market performance. Continued network activity could point to ongoing usage, whereas declining activity combined with weaker prices may indicate reduced participation.
Nevertheless, the chart does not provide sufficiently clear, exact latest readings to establish a definitive change in network demand.
The chart’s activity values should also be distinguished from transaction counts and active-address figures, which use separate scales.
Litecoin Price Prediction: Can LTC Recover $63?
Litecoin’s near-term outlook hinges on whether buyers can defend the $59–$59.40 support zone.
A move back above $63 could refocus attention on the $64.45 resistance, with the $67.07 moving average next. Should selling pressure drive LTC below the $59.39 lower Bollinger Band, $54.18 would be the next significant downside level to monitor.
At present, the RSI points to weakening momentum, while falling open interest indicates lower speculative exposure. Before considering a recovery toward $63 as sustainable, traders will look for firm support and renewed buying activity.
Also Read: Litecoin Price Holds $60 as Network Activity Nears $1 Billion