LSK price analysis shows growing bearish pressure as the price trends lower on April 29, 2026. The Lisk price trades near $0.124, down over 3% in 24 hours, according to CoinMarketCap.
According to Crypto Patel, LSK remains inside a weak range after distribution, signaling downside continuation risk. This structure increases the likelihood of further downside if support levels fail.
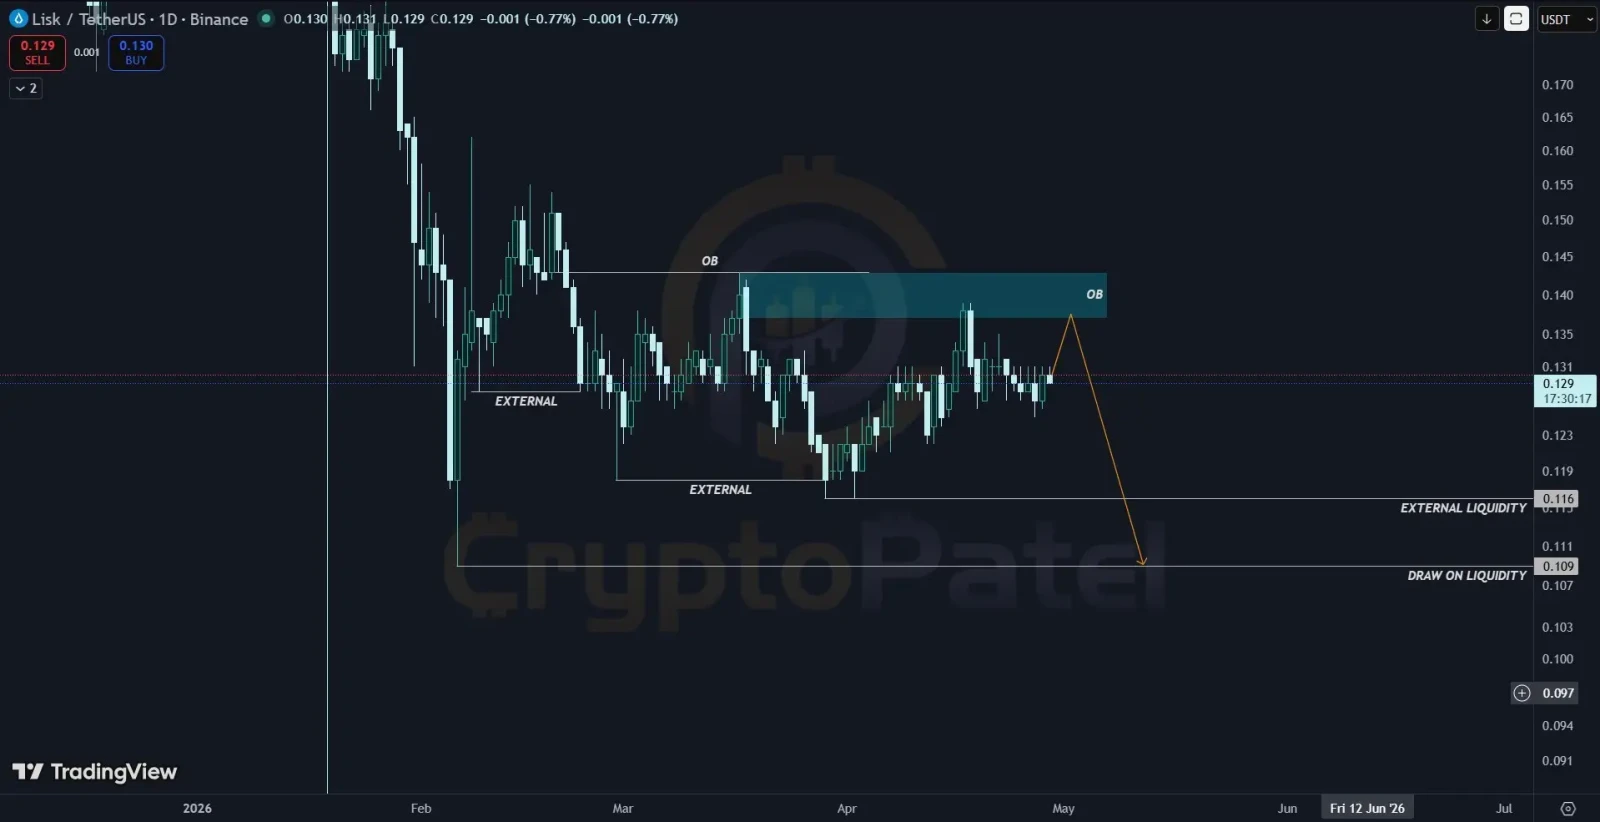
Crypto Patel identified an additional bearish setup designed to target sell-side liquidity located beneath current price points.
Further reinforcing this perspective is that derivatives have shown declining sentiment among futures market participants. This is indicative of waning bullish momentum and firm resistance near the upper bound of the trading range.
Indications of Bearish Momentum
Crypto Patel pointed out that LSK has traded in a range since the completion of the distribution phase. This was established through equal lows occurring below the range. These represent major sell-side liquidity targets.
The established order block above the present price point represents significant resistance. A price reaction to this area signifies limited upside strength.
In addition, the LSK token has experienced limited bullish displacement. Therefore, it lacks the conviction to be able to sustain rallies. The failure-based price action significantly increases the chance of further downside.
Additional details regarding these targets were provided by Crypto Patel, as follows: $0.120, $0.116, and $0.109. An invalidation of this forecast will occur only when LSK closes above $0.144 on a daily chart.
Also Read | Zcash Holds Strong Above $320 Support: Can ZEC Rally to $400 Next?
Derivatives Data Suggest Decreasing Conviction Across Markets
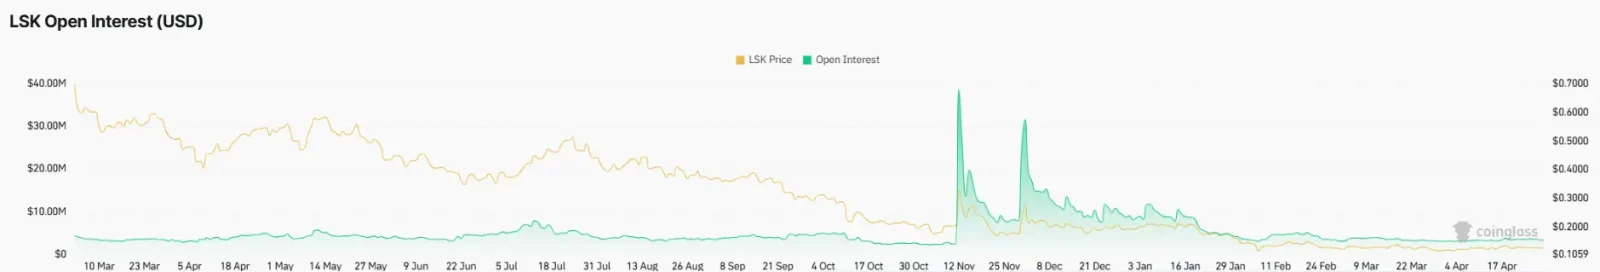
A second indicator of decreasing conviction was evident among derivatives market participants. As shown by CoinGlass, futures volume for LSK has increased by more than 34% in comparison to earlier periods.
However, open interest has decreased by almost 6%. Data shows a difference between these two may indicate uncertainty about future price movements rather than confidence in a specific direction.
Additionally, the long-to-short ratio on Binance showed that longs have dominated shorts. This suggests increased downside volatility if liquidations are triggered.
Liquidations Increase Market Vulnerability
Based on CoinGlass data, long liquidations of over $5,800 have taken place. Short liquidations represented only a zero portion of the total number of liquidations that took place.
The largest single liquidation recorded exceeded $3,300, demonstrating a high degree of long concentration. Furthermore, data shows that the majority of liquidations took place within a very brief period. This suggests elevated volatility if support levels break.

Momentum Indicators Suggest That Trend Strength Is Weak
Additionally, the technical indicators from TradingView are consistent with the bearish LSK price analysis. Data shows that RSI has remained around 35. This indicates weak buying pressure but no extreme level of oversold conditions.
There are still negative readings being printed by MACD. These continue to indicate sustained bearish pressure. Furthermore, the Lisk price currently trades under all major moving averages (20, 50, and 200 EMAs).
Therefore, the current LISK price configuration reinforces an overall downtrend across both short- and midterm timeframes.

Signals For Additional Lisk Price Decline
Based on the information available, there is a strong indication of a bearish short-term LSK price action. Unless there is a reclamation of significant resistance levels, the structure will remain vulnerable.
An additional LSK price prediction scenario would be a further decline towards areas of lower liquidity once support is broken. Data shows weakness across both technical and derivatives indicators. This suggests continuation of the bearish trend.
This shows alignment with the larger-than-normal weaknesses in both technical and derivative indicators.
Market Outlook For Lisk
Crypto Patel states that there is a need to wait for a retest of an order block before entering a position. This LSK price analysis recommends confirmation on smaller timeframe charts prior to attempting to target zones of high liquidity.
This article contains market analysis and price predictions. These are not guarantees. Crypto markets are volatile. Always DYOR. Not financial advice.
Also Read | MTL Price Analysis Signals Breakout Toward $0.311