
Pepe (PEPE) is approaching a key technical stage as a tightening falling wedge pattern signals a potential breakout for the PEPE price. Analysts are watching for bullish confirmation, while improving RSI and MACD indicators suggest recovering momentum and growing buying pressure heading into the end of June.
At the time of writing, PEPE is trading at $0.000002887 with a 24-hour trading volume of $124.84 million and a market capitalization of $1.19 billion. Following the 1.79% gain over the last 24 hours, the PEPE price structure and improving technicals point to a bullish reversal ahead.
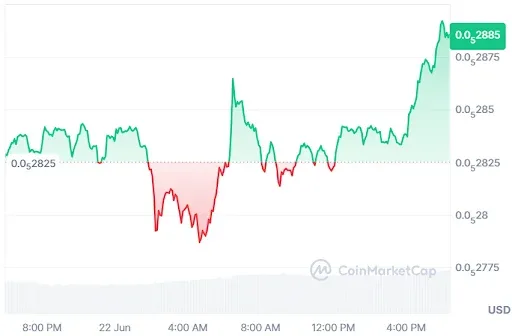
Source: CoinMarketCap
Also Read: PEPE Price Hints at a Reversal to $0.00000349 as Falling Wedge Pattern Forms
PEPE Price Targets $0.00001050 After Wedge Squeeze
Furthermore, the crypto analyst Hailey LUNC XRP highlighted that PEPE is heading toward a key technical point as it nears the completion of a giant falling wedge pattern on the daily time frame.
The PEPE price action has arrived at the peak of the pattern, where not much consolidation can be expected anymore. Analysts point out that this kind of pattern normally precedes a big move.
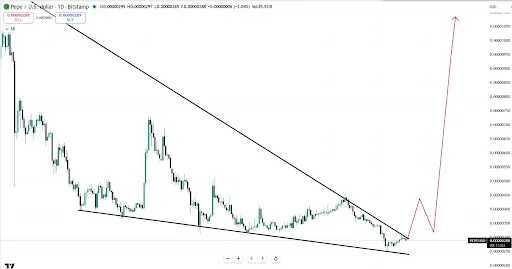
Source: Hailey LUNC XRP’s X Post
However, market players are looking out for an eventual breakout candle above the critical level to confirm the strength of bulls and set the tone for the coming macro rally in the PEPE price.
In case there is a takeover by bulls, the level of $0.00001050 should be considered the next critical upside level for the PEPE price.
Momentum Indicators Reinforce Upward Momentum
According to TradingView, the PEPE price indicates the recent trend in the momentum of the asset.
The 14-period Relative Strength Index shows a rapid fall from being in overbought conditions in May to oversold conditions in June. At present, the RSI line is at 41.00 and has crossed the signal line to confirm the PEPE price rise.

Source: TradingView
However, there is a confirmation of the formation of this bullish reversal pattern through the MACD indicator.
Following the downward trend and bearish momentum marked by the red histogram bars, the blue MACD line has now moved above the orange signal line and is being reinforced by increasing green histogram bars.
This article contains market analysis and price predictions. These are not guarantees. Crypto markets are volatile. Always DYOR. Not financial advice.
Also Read: PEPE Price Prediction: Liquidity Squeeze Signals Breakout Toward $0.0033