
- PEPE is showing a bullish flag pattern on the 8-hour chart, indicating a potential trend reversal despite recent market volatility.
- The coin is holding above a key support level, suggesting buyers may step in to drive the next upward move.
- Analysts are targeting resistance levels at $0.00001050 through $0.00001600, based on historical reaction zones and Fibonacci extensions.
PEPE is on the way to its positive trajectory and experiencing a surge in its price against the overall market due to the Iran and Israel conflict. PEPE is showing a bullish flag pattern, which often predicts a bullish reversal. Now the coin is eyeing the $0.000016, which is known as a strong barrier. Both traders and investors are closely watching this coin and expecting a bullish reversal from the recent market volatility.
At the time of writing, PEPE is trading at $0.000009673 with a 24-hour trading volume of $671.6M and a market cap of $4.06B. The PEPE price over the last 24 hours and over the last week has been hit by market volatility and is moving in a downward direction but is also making a structure for a trend reversal in the coming days.
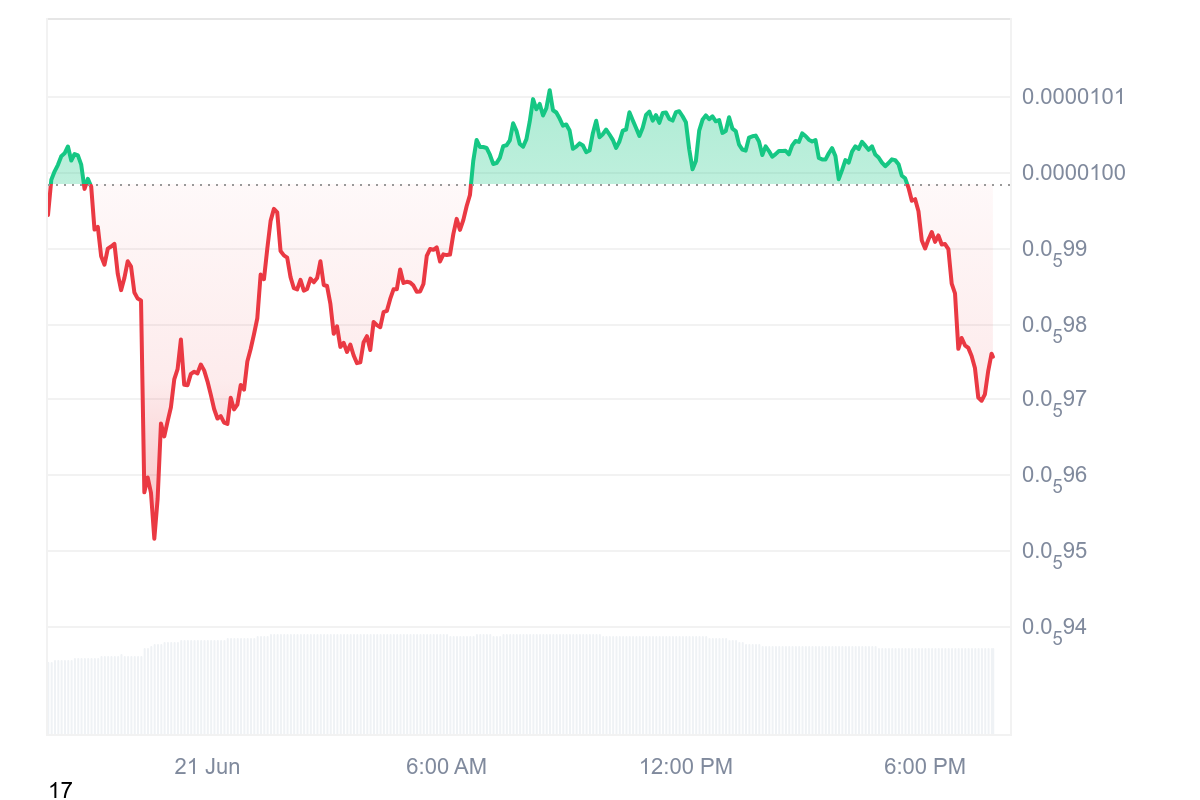
Source: CoinMarketCap
PEPE Eyes $0.000016 After Bullish Flag Setup
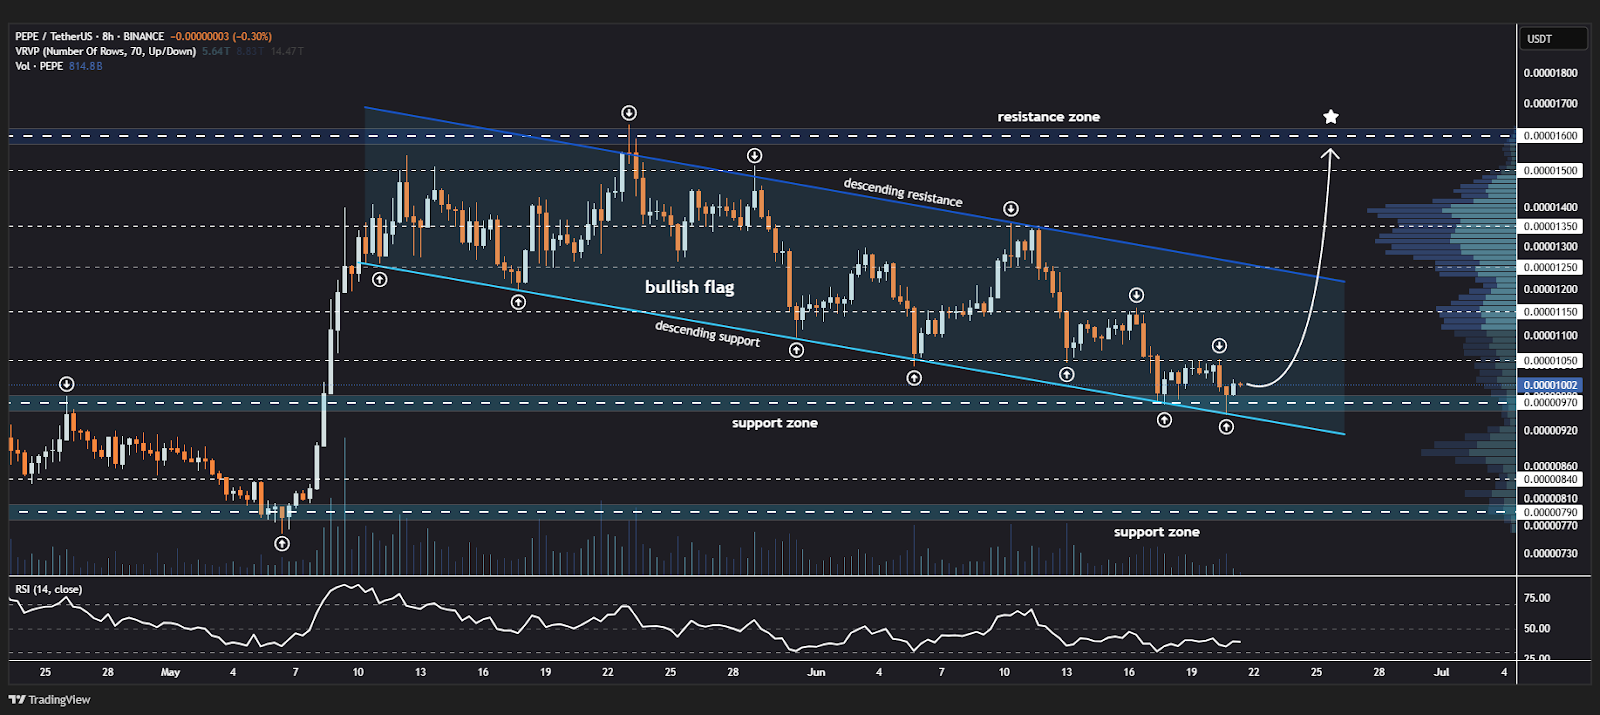
However, the crypto analyst highlighted that an important technical scenario is emerging on PEPE’s 8-hour chart, as the price does not seem willing to go below the support of a well-defined bullish flag.
This formation is often labeled as a continuation pattern, which suggests that after this consolidation phase, PEPE may be poised for another upward movement. A number of traders appear to expect that this support area will trigger a substantial price increase.
After the significant upward price movement, a bullish flag was formed, which created lower highs and higher lows. Price action is currently testing the flag’s lower support, a zone that could act as support if buying pressure enters.
This area is usually considered very critical, as crossing below it would invalidate the rebound, while a bounce from it would confirm resumption of the preceding trend.
Source: X
If the token rebounds from this key support level, multiple upside targets can be reached. These include resistance levels at 0.00001050, 0.00001150, 0.00001250, 0.00001350, 0.00001500, and 0.00001600. At each of these points lies a significant chance that the asset will encounter temporary selling pressure during its ascent
The mentioned levels alongside Fibonacci extension levels and prior reaction zones hold significance from the technical analysis perspective. In this case, these targets provide an upward direction for the next potential rally phase.
Related Reading: Bitcoin Poised for Breakout, Eyes New High Above $110K