
Pi Network (PI) is moving in an upward direction despite the bearish conditions in the crypto market. According to CoinMarketCap, the PI price has surged by 3.23% over the last 24 hours and 12.01% over the last week.
At the time of writing, the token is trading at $0.1876, with a trading volume of $40.99 million, which has surged by 44.71% over the last 24 hours. However, its market cap stands at $1.93 billion, which has surged by 3.34%.
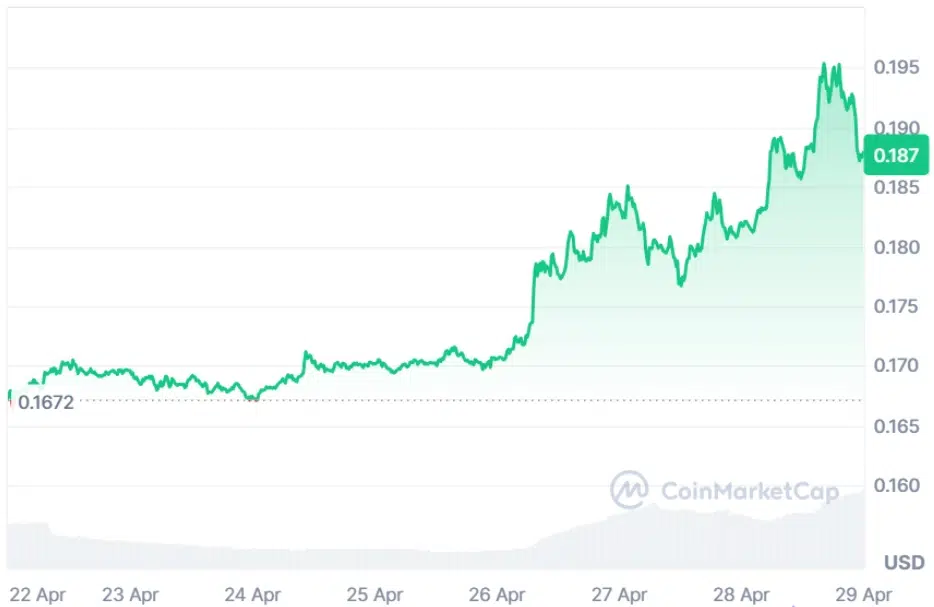
Source: CoinMarketCap
Also Read: Pi Network Upgrades Mainnet to Protocol 20 as Smart Contract Rollout Nears
PI Coin Breakout Signals 1400% Rally Potential
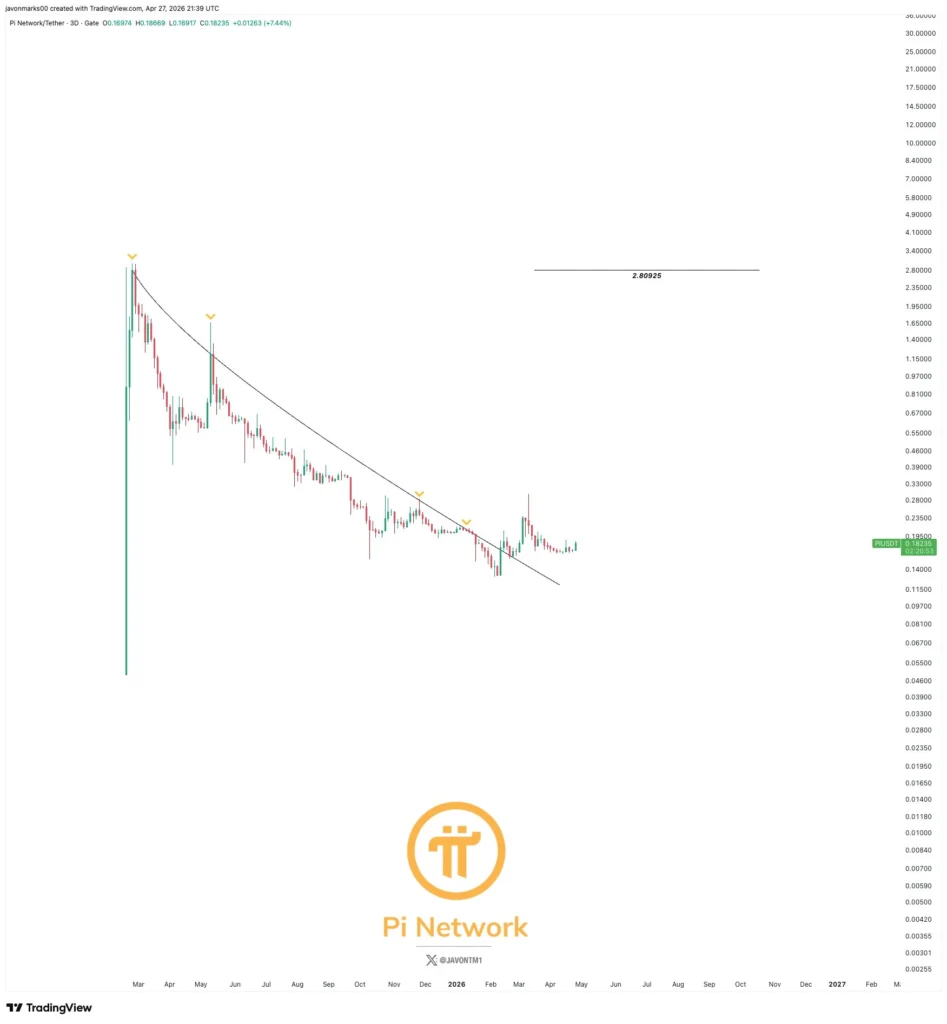
Furthermore, the crypto analyst Javon Marks highlighted that the token has delivered a strong breakout above a major resistance trendline that controlled price action for more than a year.
After breaking through, the token successfully retested the level, turning old resistance into new support. This confirms growing bullish momentum and signals a possible long-term trend reversal ahead. Traders are now closely watching this level for continued strength.
Source: Javon Marks’ X Post
Given that the breakout is already verified, the possibility for the token to enter the beginning of a major rally phase is seen by analysts.
Based on price targets, there might be a chance that the upside will exceed 1,400% and touch $2.80. Should demand continue, this might only be a mere precursor to an even greater bullish trend ahead.
Technical Indicators Point a Shift to Bullish Reversal
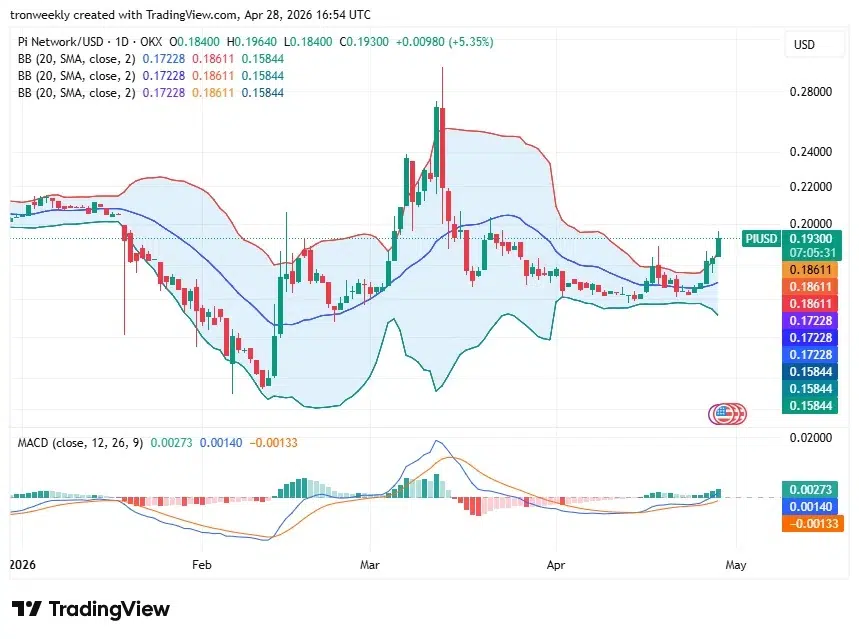
According to TradingView, notable volatility can be observed in the initial months of the year 2026 concerning the value of the token.
With an impressive decline in value in the month of February to $0.15, a rally in the price was experienced in March to reach $0.28, only for it to fall again. It is currently trading at a value of $0.193, indicating a growth of 5.35%.
Source: TradingView
The technical indicators further validate the above surge in the price movement. The Bollinger Bands’ midline is crossed over by the price at the level of $0.186 with a move towards its upper band.
In addition, the MACD provides a bullish crossover due to the fact that the indicator changes to green in the histogram.
Also Read: Pi Network Reaches 18 Million Verified Users, Challenges Crypto Growth Metrics