
- Pi Token is trading at $0.645 with a slight 0.63% intraday gain, but the broader trend remains bearish.
- The price is below all key moving averages, with resistance near $0.717 and $0.742.
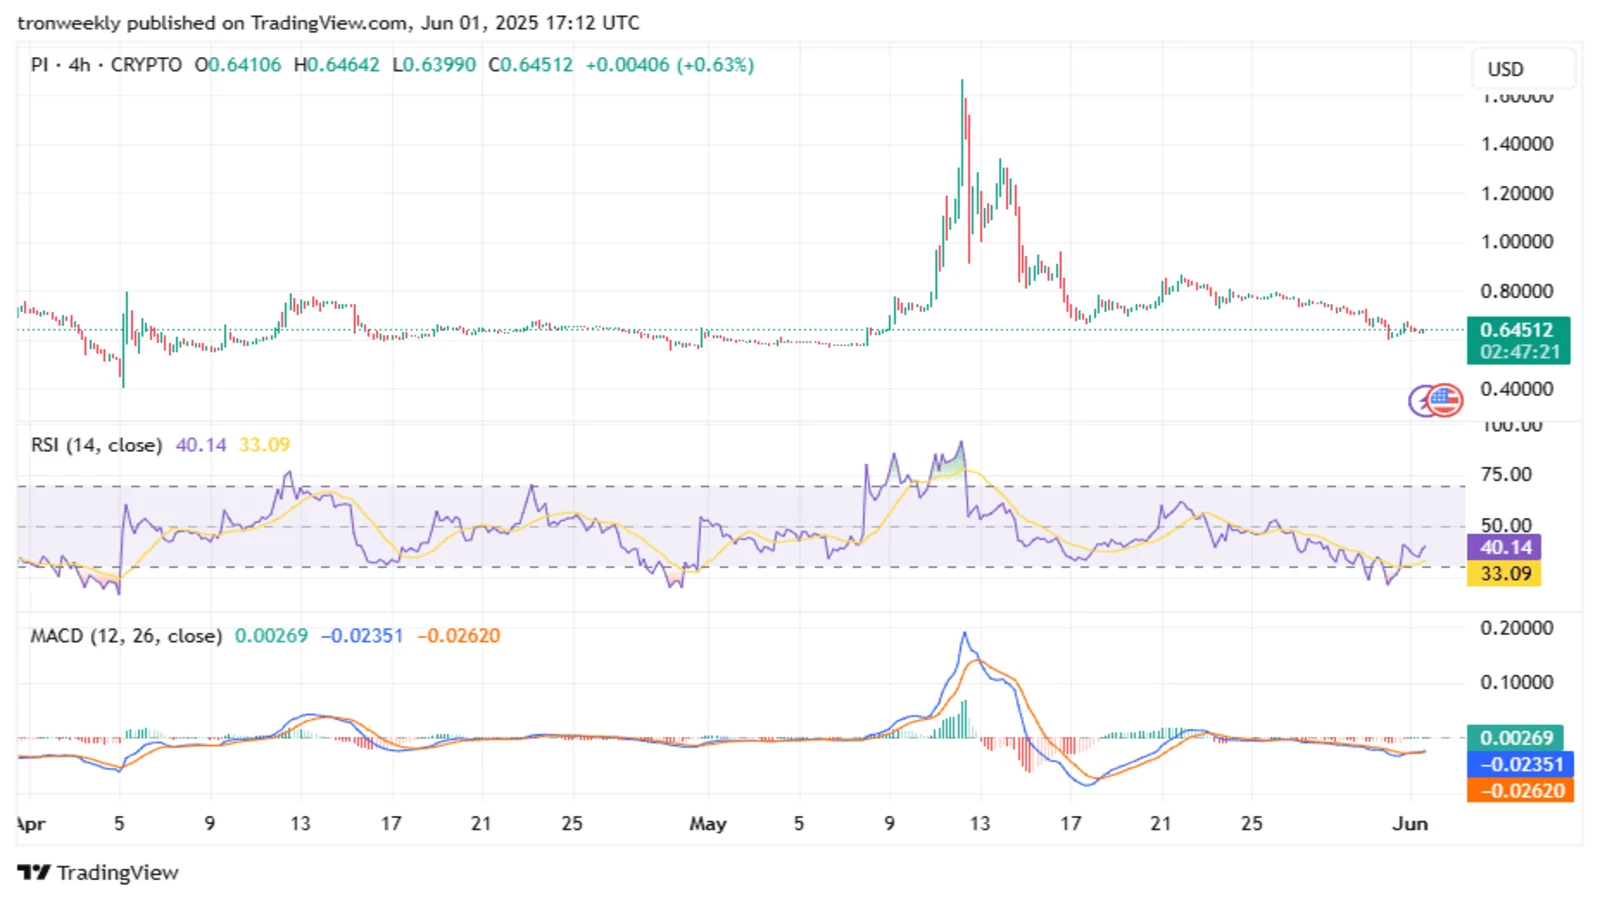
- RSI is at 40.14, showing weak momentum despite a small bounce from recent lows.
- MACD shows a mild bullish crossover, but low volume suggests limited upside for now.
Pi token is trading at $0.645, reflecting a slight intraday gain of 0.63%. Despite the short-term uptick, the overall trend remains bearish. Pi Token is showing weakness across multiple technical indicators after a sharp rise and fall in May, where it spiked above $1.60 before losing momentum. Current market behavior suggests that sellers are still in control, and any potential recovery is yet to be confirmed by volume or trend shifts.

PI Token Faces Resistance Below Key Averages
From a technical standpoint, the price is positioned below all major moving averages. The 20-day SMA sits at $0.658, while the 50-day and 100-day SMAs are at $0.717 and $0.742, respectively. The 200-day SMA is higher at $0.752. These levels are acting as resistance, and the token would need to break above the 50-day average before any serious reversal can be considered. Until then, the overall structure favors continued selling or sideways movement.
Bollinger Bands suggest some early volatility expansion, with the lower band around $0.597 and the upper band near $0.719. The price is hugging the lower side, which often indicates oversold conditions, but this alone isn’t enough to signal a trend change. The RSI (Relative Strength Index) is currently at 40.14, with a recent bounce from 33.09. This reading shows that momentum is weak, and although it’s off the lows, it hasn’t crossed the 50 level that typically signals bullish strength.

The MACD (Moving Average Convergence Divergence) shows a slight bullish crossover, with the MACD line at 0.00269 just above the signal line at -0.02351. However, the histogram is barely positive, suggesting a possible short-term bounce but no strong upward momentum yet. Volume has also dropped since the mid-May peak, reflecting hesitation from both buyers and sellers. This type of setup often leads to sideways price action until a new catalyst enters the market.
Support for Pi Token sits near $0.597, while resistance levels are stacked at $0.658, $0.717, and $0.742. A close above $0.717 would be an early sign of a reversal, but the market would also need rising volume and follow-through buying to confirm any shift in trend. Without that, the price risks retesting the lower support range.
PI token remains in a bearish phase despite a slight price recovery. Technical indicators show weak buying interest, and the price is still under key moving averages. Traders and investors should watch for a clear move above the 50-day SMA and an RSI above 50 to suggest a more meaningful change in direction. Until then, the bias remains to the downside, with the next potential support test near $0.60.
Related Reading | Crypto Alert: Teen Hackers Exploit SIM Vulnerabilities in Massive $37M Heist