
The DASH price is moving within a broader accumulation phase, suggesting possible further base building before a breakout. Momentum indicators hint at short-term bullishness, but overall consolidation remains. Neutral RSI and declining volume and open interest signal caution, while long-term structure supports potential future upside.
At the time of writing, DASH is trading at $42.66 with a 24-hour trading volume of $89.54 million and a market capitalization of $541.85 million. Following the 1.42% surge over the last 24 hours, DASH is poised for the break toward new highs with improved momentum.

Source: CoinMarketCap
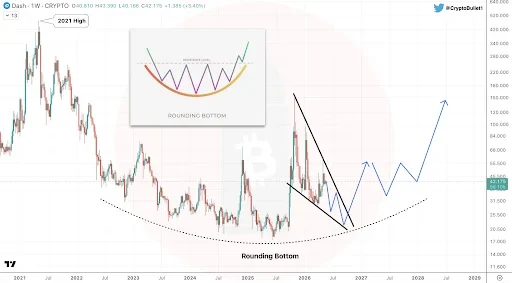
DASH Falling Wedge Setup Targets Break Above 2021 High
Furthermore, the crypto analyst Crypto Bullet pointed out that the DASH price structure indicates a developing macro rounding bottom with a nested falling wedge, suggesting long-term accumulation after the prior cycle’s decline.
The DASH price action may still revisit the $20–$25 support zone, acting as a final liquidity sweep before trend resolution. Such behavior often precedes broader bullish expansion in late-stage accumulation phases over extended broader market cycles.
Source: Crypto Bullet’s X Post
Long-term projection suggests continued base-building through 2028/2029, with eventual breakout potential above the 2021 cycle high if the multi-year structure completes as expected.
This marks a full transition from accumulation to expansion and confirms a structural shift in market regime driven by sustained demand and macrocycle recovery conditions over an extended crypto cycle phase upward.
Also Read: DASH Price Prediction: Bulls Target $50 as Structure Turns Positive
Momentum Indicators Point to Bullish Shift
According to TradingView, the MACD is suggesting that an upward trend is emerging for the DASH price, with the blue line crossing above the orange signal line at levels -0.25928 and -0.51970, respectively.
The histogram follows the same movement, becoming positive at 0.26042. However, considering that both lines are still below the zero level, the DASH price outlook is quite fragile.

Source: TradingView
The RSI indicator is trading within a neutral range, being at 50.16 and balanced on the borderline of overbought and oversold levels. The indicator slightly surpasses the level of its yellow moving average of 44.88, indicating that the asset is recovering from its drops at $41.00. There are no overbought levels detected.
DASH Derivative Data Point to Cautious Optimism
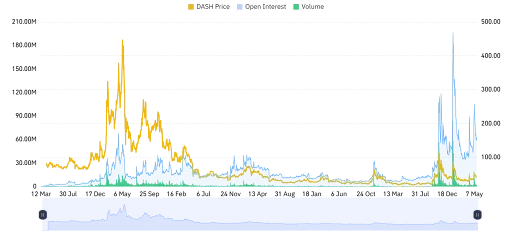
Additionally, open interest in Dash fell by 1.07% to stand at $59.97 million. The slight fall in the open interest indicates lower numbers of derivatives being held, implying lower activity levels and reduced participation in the market.
Source: Coinglass
However, there has been a decline in the trading volume by 31.87% to $86.73 million, which implies less participation in the market. This trend suggests that the momentum is fading and there have been fewer trades in the market, particularly when compared with previous periods.
This article contains market analysis and price predictions. These are not guarantees. Crypto markets are volatile. Always DYOR. Not financial advice.
Also Read: DASH Price Could Surge Toward $143 if Bulls Maintain Key Support Level