
DASH is attempting a recovery after defending key support following a falling wedge breakout. Technical indicators show weakening short-term momentum as the DASH price tests major EMAs. Meanwhile, declining open interest and trading volume reflect cautious sentiment and reduced trader participation in the derivatives market. According to CoinMarketCap, DASH is trading at $41.12 with a daily decline of 9.02%.
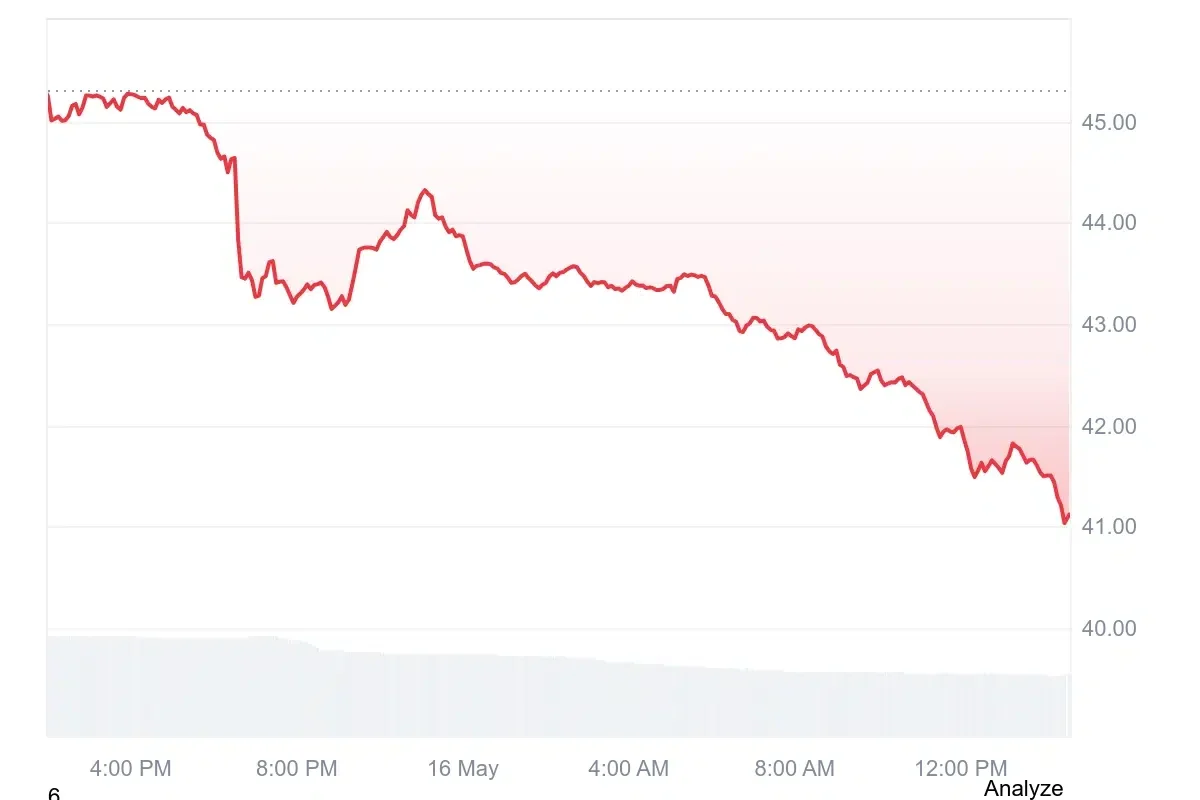
Source: CoinMarketCap
Open Interest and Volume Shows Decreasing Activity
According to Coinglass, the DASH open interest declined by 15.01%, falling to $56.03 million. This decrease indicates that traders are closing positions and reducing exposure in the market. Lower open interest often reflects weakening participation, declining speculative activity, or expectations of reduced volatility in the near term.
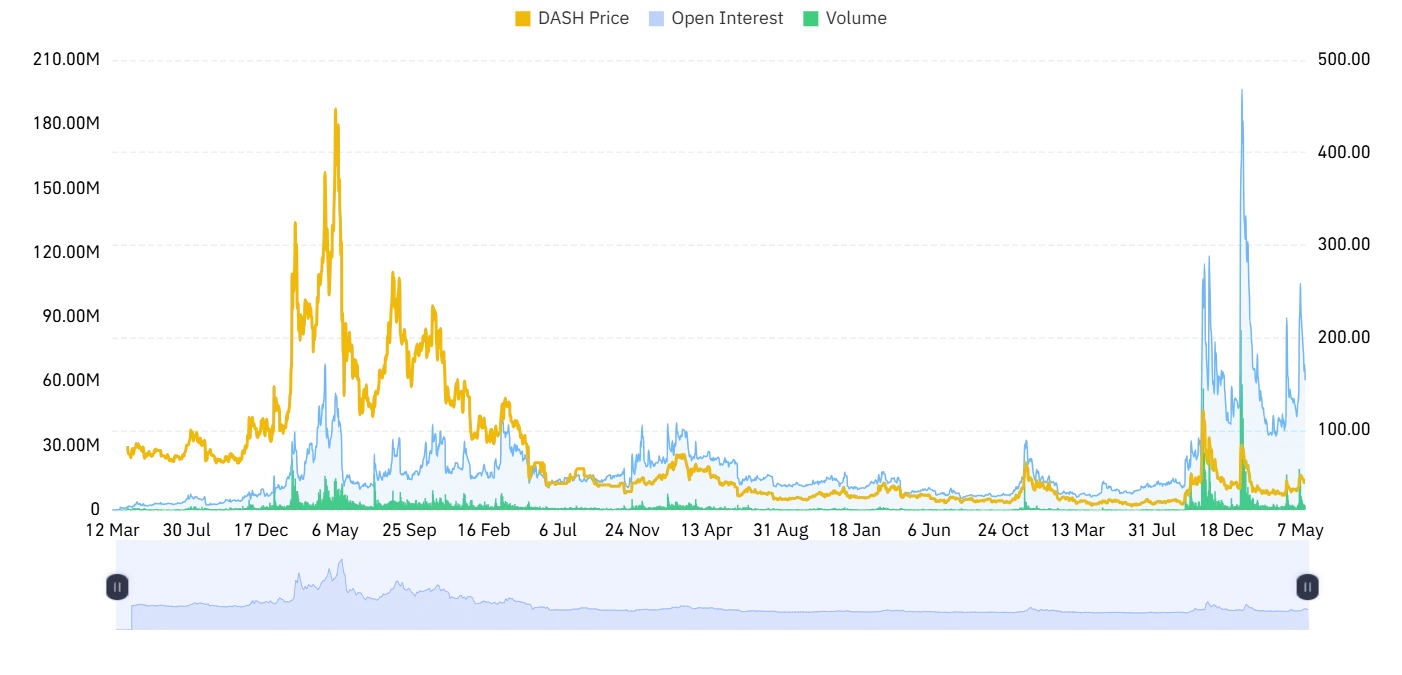
Source: Coinglass
Trading volume also dropped significantly by 26.89%, settling at $73.64 million. The decline suggests lower market activity and reduced engagement from investors. Such a decrease may point to cautious sentiment among traders and a temporary slowdown in overall market momentum.
Also Read: DASH Price Prediction: Breakout Setup Could Trigger Rally Toward $476
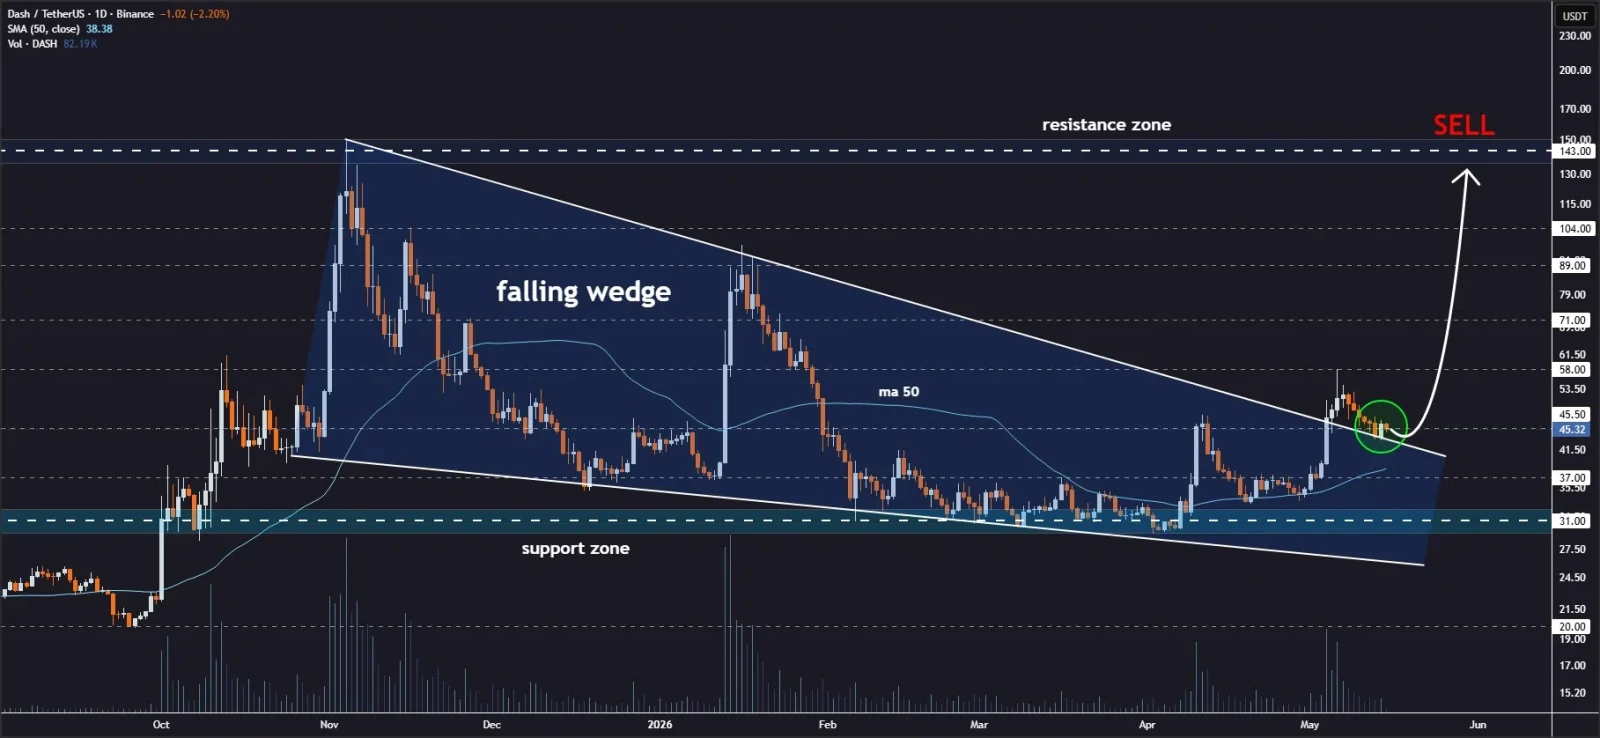
DASH Price Eyes $143 as Bulls Defend Key Support
Furthermore, the crypto analyst Jonathan Carter pointed out that Dash has started moving upwards as it managed to break out of a tested broken falling wedge formation.
The move is expected to be continued due to the support from buyers who have managed to defend all key support levels, hence creating market confidence. The experts anticipate the next bull trend due to the retested confirmation.
Source: Jonathan Carter’s X Post
As the DASH price targets an extension of its recovery rally, market analysts have begun focusing on its recovery levels.
These levels include $58 and $71, and with an increased bullish momentum, they can be driven to levels of $89 and $104. With more bullish momentum in the wider cryptocurrency sector, the DASH price may target levels up to $143.
Technical Indicators Point to Decreasing Strength
According to TradingView, the trend for DASH starts from a severe fall, followed by an initial attempt to recover. The DASH price hit its peak near $90.00 before falling with precision throughout March to reach $30.00.
A strong positive breakout at the start of May saw the price of Dash surpass $58.00, only to undergo a significant retracement afterward.
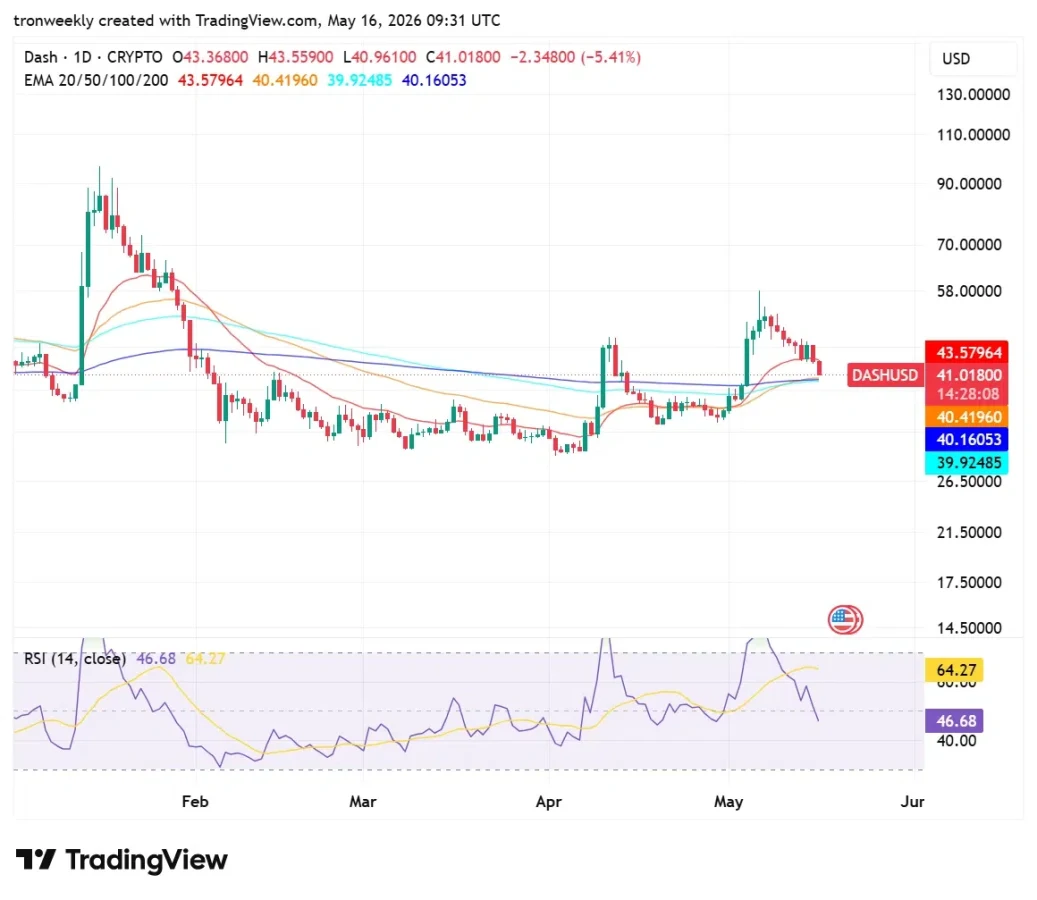
Source: TradingView
Currently, the DASH price hovers at roughly $41.018, below its 20-day exponential moving average (EMA). This is the point where the DASH price is testing support, as all three critical averages, i.e., the 50-, 100-, and 200-day EMAs, are at $40.00.
With regards to the RSI, the indicator currently stands at 46.68, indicating bearish short-term pressure on the asset.
This article contains market analysis and price predictions. These are not guarantees. Crypto markets are volatile. Always DYOR. Not financial advice.
Also Read: DASH Price Prediction: Bulls Target $50 as Structure Turns Positive