
Hedera Hashgraph (HBAR) price has entered a weak consolidation phase after facing selling pressure. Its price direction is highly unpredictable, with upward momentum failing to gather steam. The subsequent move will depend on whether the support level is breached or defended in the coming days.
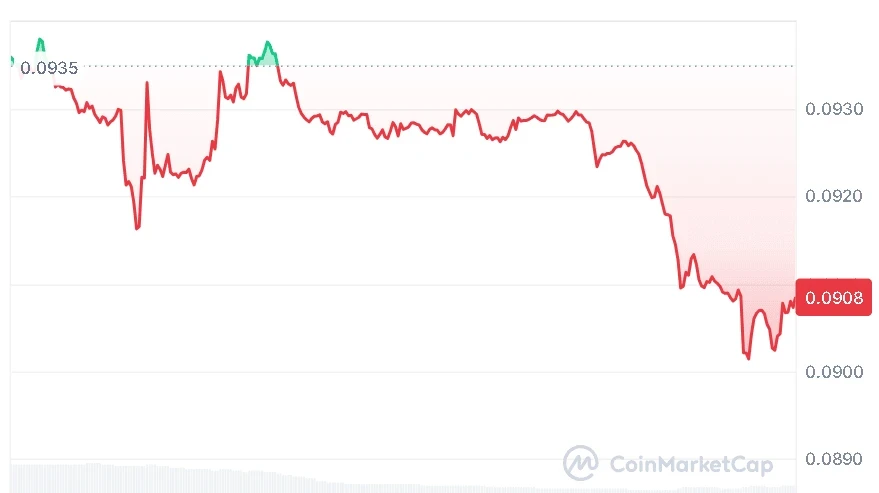
At the time of writing, HBAR is trading at $0.09081. Over the last 24 hours, the HBAR price has dropped by 3.05%, while trading volume stands at $119.82 million and market capitalization is around $3.93 billion. The recent movement shows that the HBAR is still struggling to build strong upward continuation after short rebounds.
Also Read | Cardano Price Holds $0.25 Support as Wealth Tech Forum Sparks Optimism
HBAR Price Remains in Correction
On May 16, 2026, crypto analyst More Crypto Online revealed that HBAR’s price is still undergoing a corrective recovery stage. Although there have been a couple of rebounds from the lows recorded during March and April, the rebound does not yet show any sign of becoming a trend.
According to the primary view, the price of HBAR might still move a little higher to reach a downtrend line marked in yellow, with resistance anticipated at $0.103. This situation remains relevant as long as the HBAR price maintains its support level of $0.078 – $0.088.
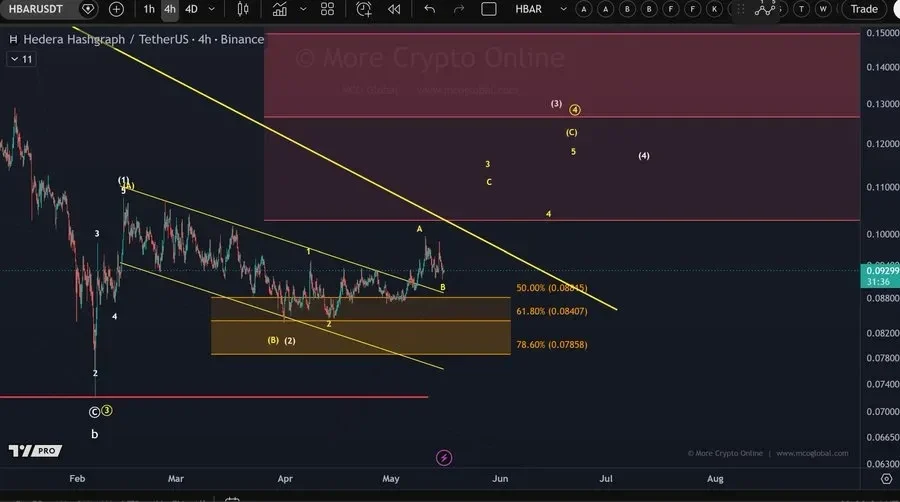
The risk setup regarding the HBAR is triggered when it drops beneath the recent swing low at $0.087. The violation of the mentioned support level will make the short-term outlook bearish and boost the likelihood that the previous bullish trend is over.
Support areas for the HBAR price stand at $0.088, $0.087, and $0.078, with resistance positioned around $0.103. In general, the HBAR price is still undergoing corrective recovery dynamics and does not demonstrate any clear bullish force.
HBAR Price Momentum Starts to Slow
In terms of technical analysis, the RSI of the HBAR stands at 47.36, with its moving average standing at 55.31. The fall below the neutral point of 50 indicates that the strength of the buying pressure is declining following the rally in May.
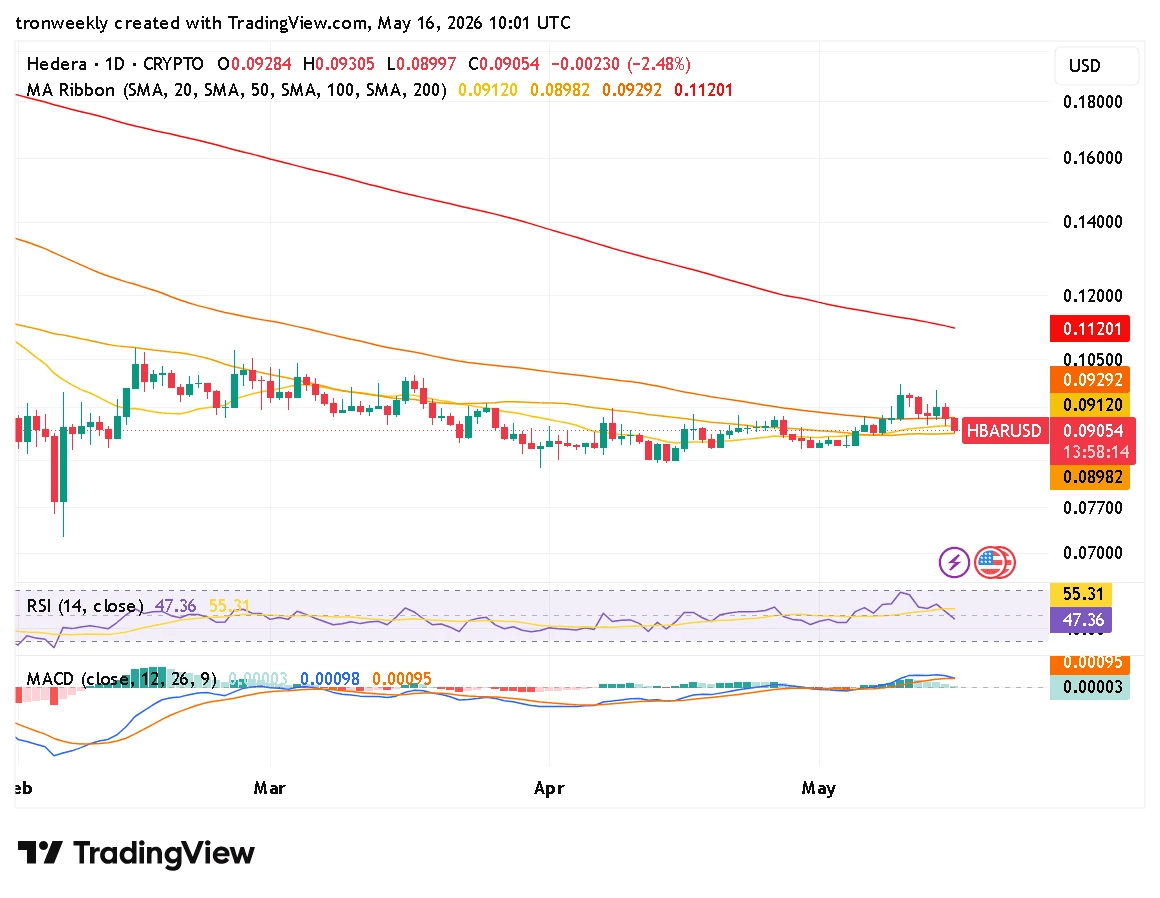
Moreover, the MACD remains slightly bullish. The MACD line stands at 0.00098, while the signal line stands at 0.00095, with the histogram being slightly positive, at 0.00003. This implies that buyers are still holding the upper hand, although the narrowing spread between the two lines means that the HBAR price may lose momentum soon.
This article contains market analysis and price predictions. These are not guarantees. Crypto markets are volatile. Always DYOR. Not financial advice.
Also Read | Dogecoin Price Could Rebound Toward $0.15 if Buyers Regain Momentum
