
DASH price shows a bullish recovery after rebounding from key support and moving toward higher resistance levels. Technical structure remains positive above major moving averages with momentum stabilizing. However, derivatives data shows declining participation, reflecting cautious sentiment despite the improving price trend. According to CoinMarketCap, DASH is trading at $44.14 with a 24-hour decline of 4.6%.
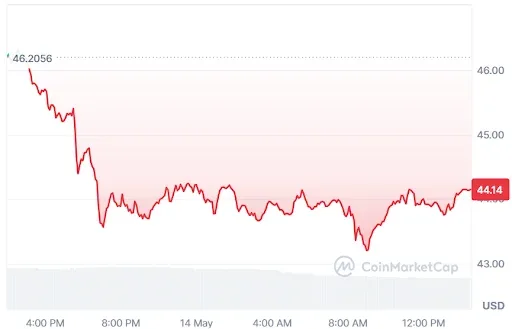
Source: CoinMarketCap
DASH Derivative Data Point to Decreasing Strength
According to Coinglass, the DASH open interest decreased by 11.63%, reaching $64.27 million, indicating a decline in active contracts within the market. This suggests traders are closing positions or reducing exposure, reflecting cautious sentiment and weaker commitment from participants.
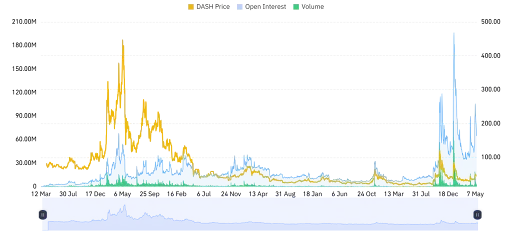
Source: Coinglass
Volume decreased by 14.38%, reaching $86.74 million, signaling reduced trading activity across the market. This decline implies lower participation and weakening momentum, potentially reflecting short-term uncertainty or reduced investor interest.
Also Read: DASH Falling Wedge Signals Potential Bullish Breakout Move Toward $250
Dash Price Action Signals Potential Rally Toward $50
Furthermore, the crypto analyst Alpha Crypto Signal highlighted that the DASH price showed renewed strength after buyers stepped in earlier than expected, preventing the price from reaching ideal limit entry zones.
Instead, a sharp rebound from the previous swing area confirmed it as solid support, shifting short-term structure bullish. The reaction suggests active demand, with volume improving and momentum beginning to favor continuation of the upward trend building for the DASH price.
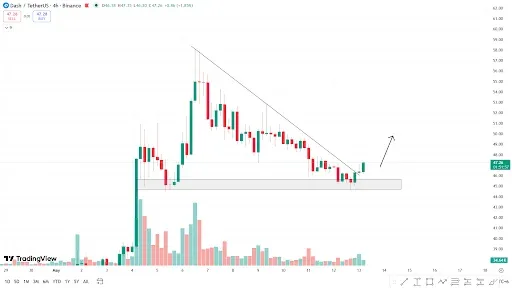
Source: Alpha Crypto Signal’s X Post
The current formation implies the potential for further developments in case momentum is maintained, as the DASH price attempts to rally past the key resistance level of $50.
Volume action continues to provide positive backing and favors bullish expectations. However, in case the closing price on the 4-hour candle falls below the defined support area, the formation will become invalid, implying a bearish outlook.
DASH Technical Indicators Point to a Bullish Shift
According to TradingView, the DASH price is making a recovery from its $28.50 support floor that was established back in March.
The DASH price experienced an extended period of dormancy until mid-May, when it witnessed a sudden surge and touched levels above $50 only to retreat. Currently, DASH is trading at $44.15, adding a slight increase of approximately +0.79%.
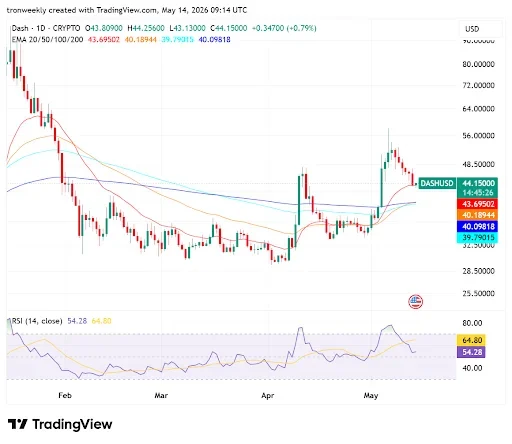
Source: TradingView
According to technical indicators, the asset shows bullish momentum formation, with the DASH price positioned above all key EMAs.
Short-term support comes from the 20-period EMA, standing at $43.69, and the RSI continues to hover around 54.28, having just tested overbought conditions. The period of consolidation implies that the market absorbs the recent profits and looks for new oppertunities.
This article contains market analysis and price predictions. These are not guarantees. Crypto markets are volatile. Always DYOR. Not financial advice.
Also Read: DASH Price Prediction: Breakout Setup Could Trigger Rally Toward $476