• Skip to primary navigation
  • Skip to main content
  • Skip to primary sidebar
  • Skip to footer
  • About TronWeekly
  • Write for us
  • Terms and Conditions
  • Privacy Policy
  • Disclaimer
  • Contact
  • All Posts
  • Advertise

TronWeekly

Crypto World News

  • Home
  • Latest News
  • Opinion
    • Education
    • Best TRON Wallets
    • Beginner’s guide to TRON
    • Tron Tokens
    • Market Analysis
  • Industry
    • Tron Exchange
    • Project Review
  • Press Release
  • Bitcoin (BTC)
  • Ripple (XRP)
  • Advertise
  • About TronWeekly
    • The Team
    • Editorial Policy
    • Write for us
    • Privacy Policy
    • Disclaimer
    • Terms and Conditions
    • Contact
You are here: Home / Cryptocurrency News / Altcoin News / Polkadot (DOT) Near Critical Low: Bulls Eye $3.00–$6.00 if Momentum Returns

Polkadot (DOT) Near Critical Low: Bulls Eye $3.00–$6.00 if Momentum Returns

What to know:

  • DOT tests major long-term support near $1.30–$1.35 on the weekly chart.
  • A rebound could open the path toward $3.00 and possibly $4.50.
  • Daily trend remains bearish below key moving averages.
  • Momentum indicators show early recovery but lack full confirmation.

By Tina Fatima | Edited By Ammar Raza,February 28, 2026, 10:00 PM

Polkadot

Polkadot (DOT) forms a long-term descending structure from the $11.00 peak. As of February 28, 2026, it tests strong support around $1.30–$1.35. A rebound here could push the price toward $3.00, the first recovery resistance level.

According to the crypto analyst @TheMoonHailey, if bulls maintain momentum, the token may face its next target near $4.20–$4.50, corresponding to previous consolidation zones.

The broader uptrend projection suggests a potential move toward $6.00, with a higher target around $10.50–$11.00 if the ascending swing pattern completes. Trend reversal confirmation requires sustained weekly closes above $3.50.

Source: @TheMoonHailey

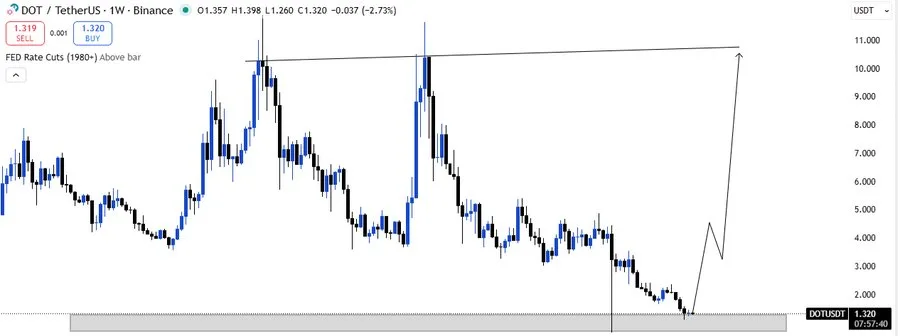
Indicators imply oversold conditions at support. A bullish divergence could accelerate upside, targeting $2.50 initially. Breakout continuation beyond $4.50 would validate higher targets of $6.00 and $11.00.

Conversely, a weekly close below $1.30–$1.25 risks extending downside, potentially revisiting $1.00–$1.10 as the next strong support zone.

Also Read: Polkadot (DOT) at Make-or-Break Level as Price Hovers Near $2

Daily Chart Highlights Persistent Selling Pressure

From a technical perspective, Polkadot on the daily timeframe remains in a strong downtrend, trading near $1.48 after rejection around $1.60–$1.65 resistance.

The Price sits below the 50 SMA at $1.64, 100 SMA at $1.85, and 200 SMA at $2.72, confirming bearish structure overall and sustained selling pressure.

Source: Tradingview

The key areas of support to target on the downside are $1.30-$1.35, the recent low of $1.13, and the psychological level of $1.00, should further selling pressure continue. To target a recovery on the upside, levels to reclaim are $1.65, then $1.85, followed by $2.30 and $2.72.

Momentum Indicators Show Early Recovery Signals

From an indicator side, the Relative Strength Index (RSI 14) recently bounced back from oversold levels around 25 and is currently trading around 45.

Although this is a sign that the bearish momentum is slowing down, the RSI is still below the middle line of 50, indicating that the bears have not yet lost control.

Source: TradingView

The MACD indicator has formed a weak bullish crossover, with the histogram bars turning slightly positive. Nevertheless, the MACD line is still below the zero line, indicating that the overall trend is still negative, despite the initial signs of a recovery. A break above the zero line would be a positive indication for the continuation of the bullish trend.

Why This Matters

A breakdown below $1.30 could accelerate the downside volatility and make DOT vulnerable to a possible move towards $1.00.

A strong bounce from this point could change the sentiment around Polkadot and make a move towards $3.00 possible.

Also Read: Polkadot (DOT) Forms Bullish Reversal Pattern as DOT Eyes $2.40 Resistance

Filed Under: Altcoin News

About Tina Fatima

Tina Fatima is a Web3 & DeFi Correspondent at Tron Weekly, covering digital assets and blockchain-based financial ecosystems. Her reporting focuses on decentralized finance (DeFi), Web3 developments, Bitcoin, altcoins, and crypto regulation, with attention to major events shaping the broader cryptocurrency market.
She tracks crypto markets on a daily basis and writes news and analysis grounded in real-time market activity, official announcements, and verified market data. Tina’s work is aimed at explaining crypto developments clearly and accurately for both beginners and experienced market participants, without speculation or investment guidance.

Primary Sidebar

Recent Posts

  • Toncoin Price Outlook: Will Momentum Sustain Above Critical $2.52 Level? May 11, 2026
  • Solana price analysis shows bullish momentum building for $206 breakout May 11, 2026
  • Crypto.com Becomes UAE’s First Fully Licensed Crypto Payments Provider May 11, 2026
  • Capital B Raises $17.8 Million to Expand Bitcoin Holdings May 11, 2026
  • Strategy Boosts Bitcoin Buying, Saylor Leads Treasury 2026 May 11, 2026

Footer

News

  • Latest News
  • Altcoin News
  • Bitcoin (BTC)
  • Blockchain
  • Tron (TRX)
  • World

Digest

  • Meet the Founder
  • Price Winning Article
  • DeFi
  • Cyber Security
  • Crypto Scam

Industry

  • Project Review
  • Technology
  • Fintech
  • Tron Exchange
  • New in Town

Tron Universe

  • Event and Tron Parties
  • New in Town
  • Tron Tokens

FOLLOW US

  • Facebook
  • Telegram
  • Twitter
  • Linkedin

Subscribe US

Editorial Policy | Privacy Policy | Disclaimer | Terms and Conditions | Masthead

Copyright © 2026 · Tron Weekly. All Rights Reserved. NOTE: Tron Weekly is an independent crypto news site that adheres to the strict journalism policy anchored on transparency, trust, and objectivity, we have no affiliation with the TRON Foundation, its founder Justin Sun or any other cryptocurrency firm.