
Polkadot (DOT), a promising cryptocurrency, is generating buzz in the crypto community with a bullish forecast suggesting substantial gains in the near term. Crypto analyst ZAYK Charts has identified a compelling pattern on the DOT/USDT 12-hour chart, predicting a 40-50% price surge for the altcoin. This projection stems from a falling wedge pattern, historically indicating a bullish market sentiment reversal.
The falling wedge pattern, characterized by converging downward-sloping trendlines, typically signals a significant price increase once a breakout occurs. Since late February, DOT’s price action has been confined to this descending wedge, experiencing a series of lower highs and lower lows. The recent breakout from this pattern marks a pivotal moment, suggesting a shift towards a more positive market outlook for Polkadot.

According to ZAYK Charts, the breakout from the falling wedge is a strong bullish indicator. The analyst predicts that DOT’s price could climb from its current level of $6.42 to approximately $9.60, translating to a potential 50% increase. This forecast is reinforced by historical trends, where assets breaking out of falling wedges often experience substantial upward momentum.
Another perspective from Changelly adds further optimism to Polkadot’s outlook, predicting a staggering 228.04% rise in DOT’s price to $20.75 by August 2024. Despite this bullish sentiment, current market indicators show a neutral sentiment, with the Fear & Greed Index at 51. Over the last 30 days, Polkadot has recorded 14 green days, reflecting a 7.68% price volatility.
Polkadot’s Current Market Dynamics
At the time of writing, DOT is trading at $6.42, showing a 1.5% increase over the past 24 hours and a 10% gain over the past week. Polkadot recently broke out from a descending trendline, which, if it holds as support, could see DOT’s price rise by an additional 6% to $6.86. This significant level aligns with the 61.8% Fibonacci retracement level drawn from a swing high in late May to a swing low in late June.
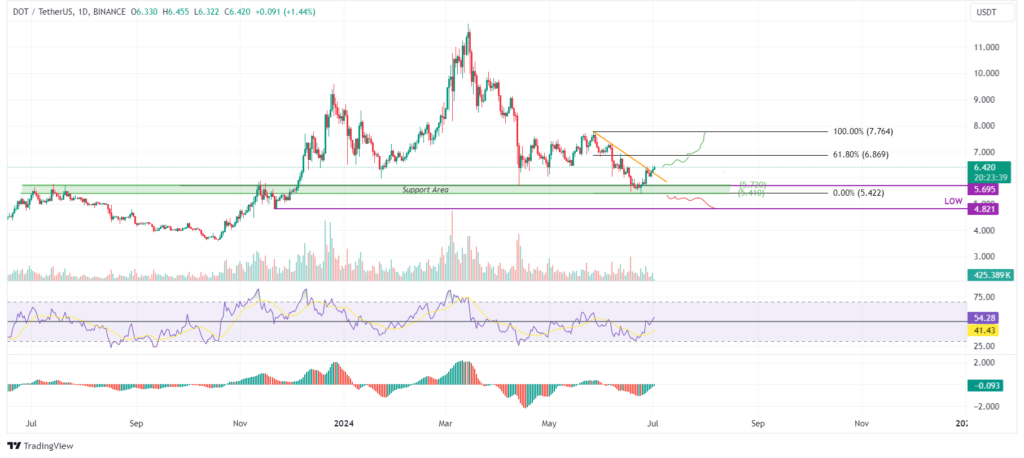
The Relative Strength Index (RSI) is above 50, indicating bullish momentum, while the Awesome Oscillator (AO) stays below zero. Both indicators must maintain positions above their neutrality levels for a sustained rally, adding further momentum to DOT’s recovery.
If DOT closes above $6.86, it could extend its rally by another 13%, potentially revisiting the daily high of $7.76 from May 27. However, a close below $5.42 could indicate a bearish shift, leading to a possible 10% decline to retest the previous low of $4.82 from November 2023.
Related Readings | Ethereum Poised For Major Breakout, Analysts Anticipate Market Shift: Report