
Polkadot price appears to be recovering from its recent downturn, with buyers still holding the price at a significant support zone on the weekly chart. The current positive trend in the technical metrics has raised hopes for the DOT Price, especially as analysts expect more gains if the bullish sentiment becomes stronger.
At the time of writing, DOT is trading at $1.31, down 0.41% over the last 24 hours. Despite the slight decline, daily trading volume remained strong at $209.80 million, while its market capitalization stood at $2.21 billion. The latest DOT Price movement suggests that investors are closely watching whether the asset can maintain support and build momentum for another upward move.

Source: CoinMarketCap
Also Read | Solv Protocol Migrates $700M BTC Assets to Chainlink CCIP
Polkadot Price Holds Key Weekly Support
Interest in the market grew after crypto analyst Butterfly shared, an optimistic view of the weekly chart formation for DOT. Butterfly believes that Polkadot is still trading above the bottom line of the descending wedge pattern, which generally indicates a favorable situation provided that support lines hold.
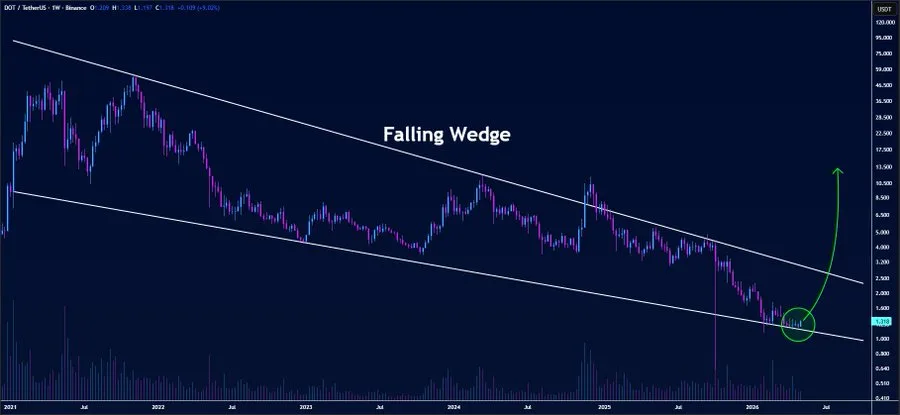
Source: Butterfly’s X Post
The analyst noted that bulls are working hard to defend the crucial level amid rising buying interest at present levels.
The recent movements in DOT Price also show that momentum is turning positive. After bouncing back somewhat from the recent lows, DOT will be looking to maintain a position above the short-term moving average ribbon marks of $1.25 and $1.27. Sustaining an above-the-supports position may help give DOT sufficient momentum to stage a recovery.
Technical Indicators Support DOT Price Recovery
The technical indicators are now on the side of the bulls as buying pressure starts to rise. RSI has moved up to 56.42, breaking through the neutral point of 50 and its signal level of 47.31. This suggests that market strength is rising from an earlier weak position.
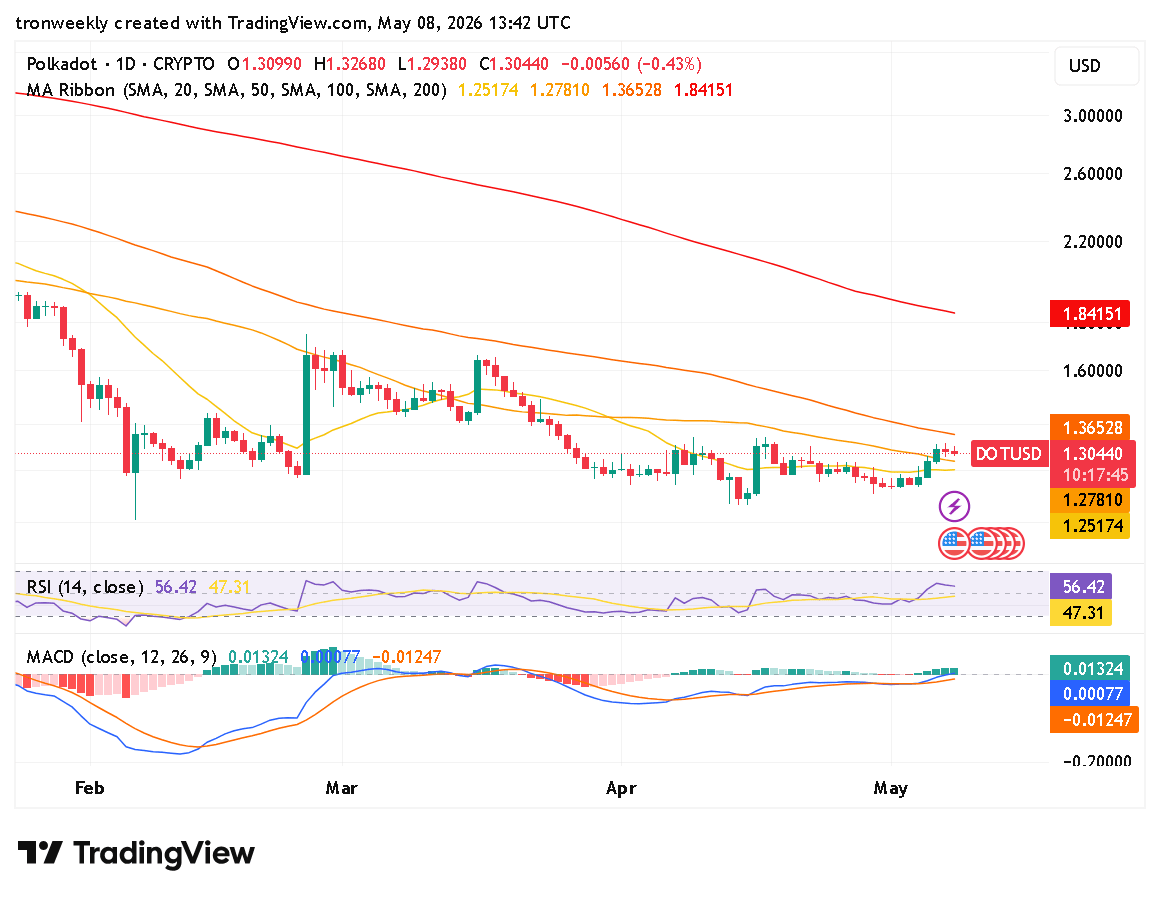
Source: TradingView
In addition to this, the MACD indicator is also showing positive readings. The MACD line has an indicator reading of 0.01324, which is now positioned above the signal line of 0.00077, while the histogram shows positive readings of 0.01247. This implies that bullish strength could continue to develop further.
With the buying force on the rise, there is a belief that the Polkadot Price will head to the next level of resistance, which lies around the 100-day simple moving average at $1.36. A break of this level will be bullish for DOT.
This article contains market analysis and price predictions. These are not guarantees. Crypto markets are volatile. Always DYOR. Not financial advice.
Also Read | Kraken Parent Expands Stablecoin Payments With $600M Reap Deal