PUMP price remained in focus. Traders watched whether support could hold after a failed resistance attempt. The setup now placed attention on reversal patterns, weakening selling pressure, and the next move across spot and derivative markets.
As of press time, PUMP price trades near $0.001466 on Saturday, down 1.23% in 24 hours. The trading volume rose 30.66% to $42.41 million, CoinMarketCap data showed. The token also lost 10.26% during the past seven days, extending its recent weekly decline in the market.

Also Read: ARB Price Signals Reversal to $0.089 Amid Buying Pressure and OBV Breakout
What PUMP Price Pattern Signals
Popular analyst Crypto Woodyz highlighted in a post on X that the token bounced off a resistance zone on its most recent pullback. The analyst also noted an inverse head and shoulders pattern on the four-hour chart. This formation is considered a bullish reversal setup.
The analyst said traders may consider a long position near current levels. The post suggests that more exposure can be added around $0.001400 or lower. A break above resistance is required for the setup to be confirmed.
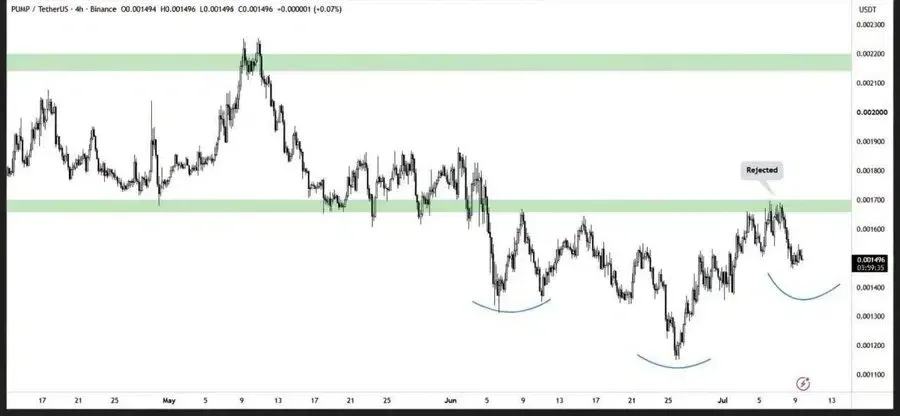
If the price moves above $0.001700, then it could have a bigger rally. Until then, the PUMP price remains below the level highlighted by analyst. However, the resistance zone remains the focus of the near-term picture.
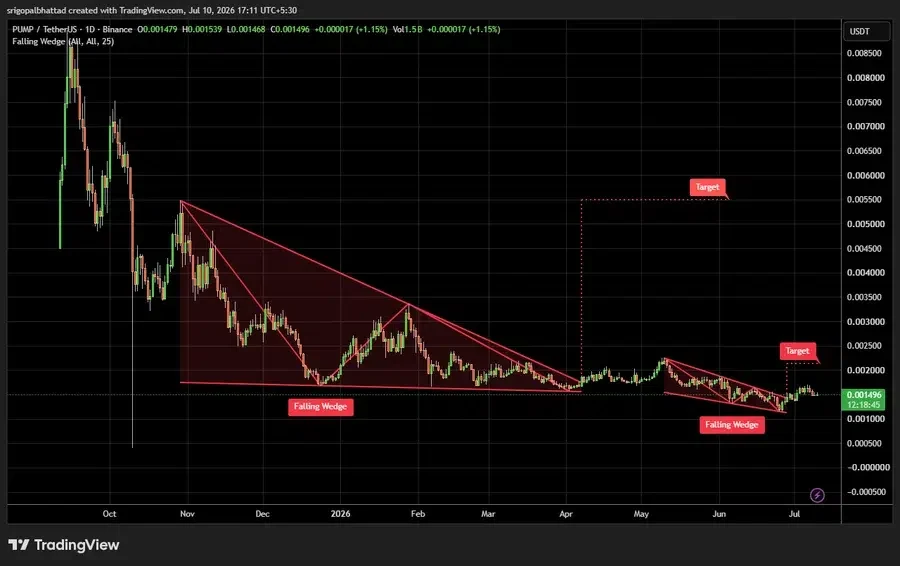
In addition, another analyst, Crypto With Gopal, revealed that the token is creating a long-term falling wedge. The building is on an extended downtrend and has fewer price compressions. The analyst said selling pressure is gradually fading inside the pattern.
Buyers are defending the $0.001400 to $0.001500 support zone. If resistance at the wedge bottom is broken, then there could be a dramatic recovery. The loss of that zone would put off the expected bullish reversal.
How EMAs Keep PUMP Price Under Pressure
According to TradingView data, the 20-day EMA stands at $0.001500 on the daily chart. The 50-day EMA is higher at $0.001558. According to the chart data, the PUMP price is lower than both the averages.
The larger moving averages are also above the market. The 100-day EMA is placed at $0.001710, while the 200-day EMA stands at $0.002226. Both averages are significantly higher than current market value.

Bollinger Bands (BB) place the middle line at $0.001463. The upper band is set at $0.001684 and the lower band at $0.001242. The PUMP price is currently trading near the middle band.
Why PUMP Derivatives Activity Increased
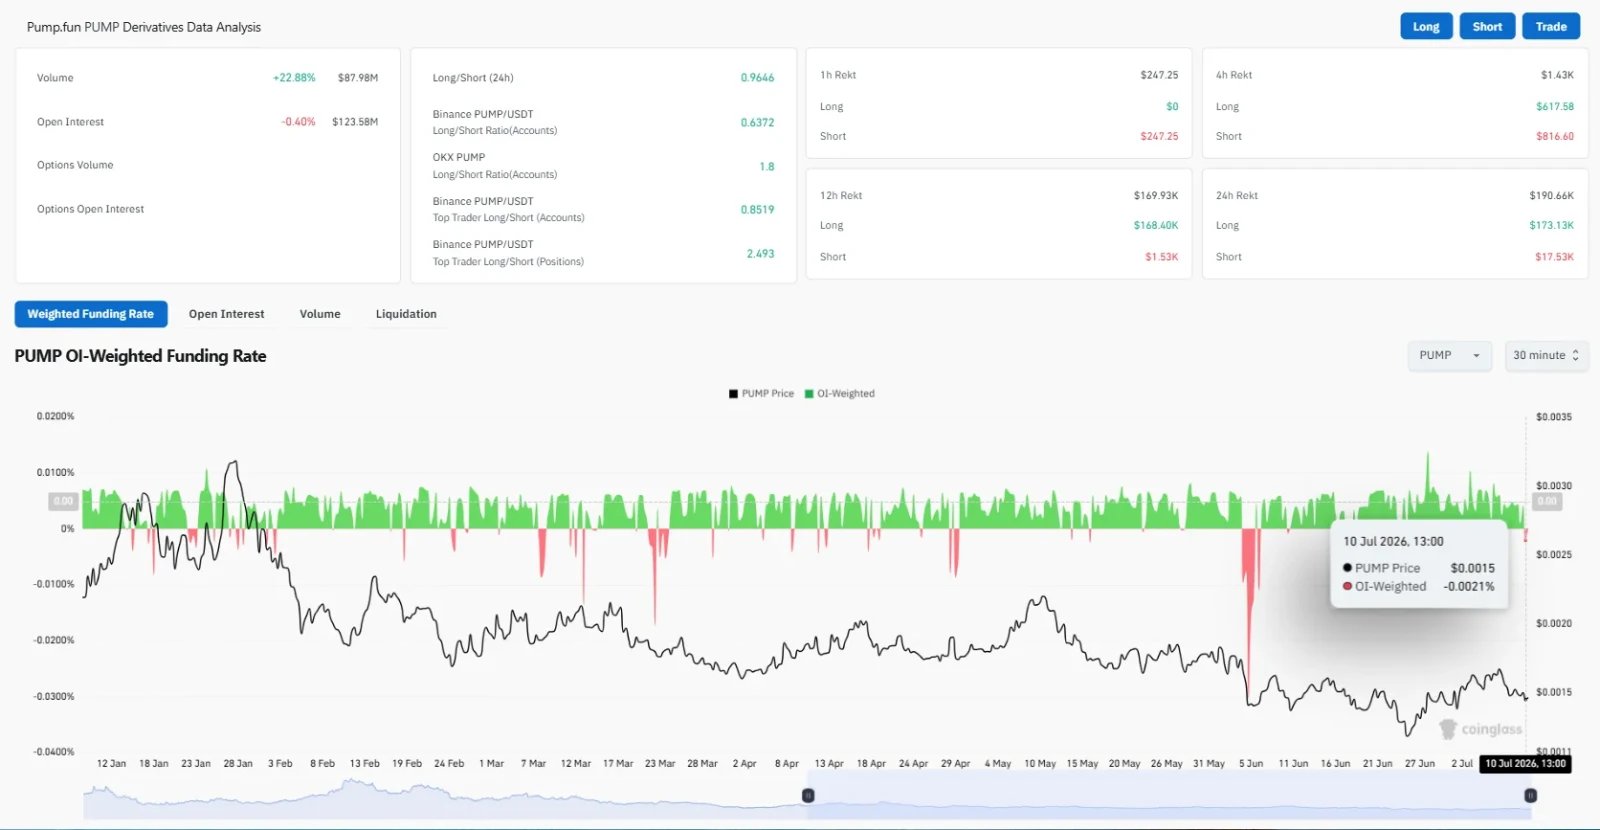
Derivative activity increased despite the decline. CoinGlass data revealed futures trading volume increased 22.88% to $87.98 million. Open interest fell 0.40% to $123.58 million. The OI-weighted funding rate stood at -0.0021%.
So far, the PUMP price now faces nearby support and the $0.001700 resistance area. Traders are watching for a confirmed breakout or a loss of the defended zone.
Also Read: AERO Price Eyes $0.65 Breakout as 87K Token Buyback Boosts Sentiment
This article contains market analysis and price predictions. These are not guarantees. Crypto markets are volatile. Always DYOR. Not financial advice.
