
Quant (QNT) price remains within a broad consolidation phase while maintaining a bearish long-term trend. Buyers continue defending key support areas, but sellers still control the overall structure. Weak momentum indicators, declining trading activity, and reduced market participation suggest sideways movement until a confirmed breakout emerges.
QNT Price Support Zone and Consolidation Analysis
The Quant (QNT) price chart shows a clear long-term downtrend on the weekly timeframe, with price forming consistent lower highs and reacting strongly to a descending trendline.
Major resistance lies near $140–$150, while strong support sits around $50–$60, creating a wide consolidation range.
Currently, price is moving sideways near support, suggesting either accumulation or a potential breakdown. Buyers are defending the lower zone, but sellers still control the overall structure.
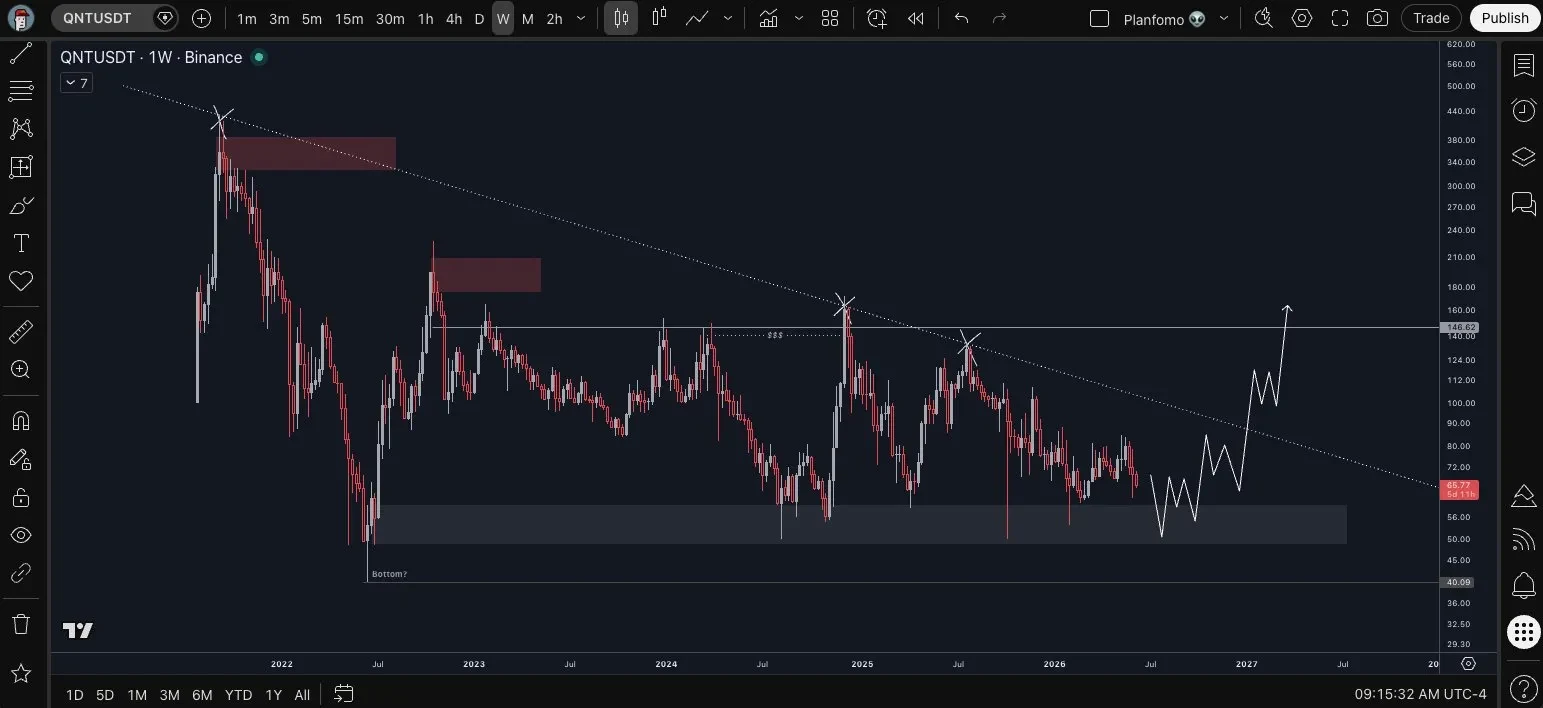
Without a trendline break, the market remains bearish despite short-term bounces and temporary upward movements.
For a bullish reversal, price must hold support and break above $150 with strong confirmation. If support fails, further downside is likely, according to the crypto analyst PlanFomo.
Traders should focus on buying near support and selling near resistance, and wait for a confirmed breakout before expecting a major upward trend.
Also Read: QNT Price Holds Key Support as Bulls Eye Long-Term Recovery Toward $670
Trend Suggests Sideways Price Movement Ahead
Momentum indicators suggest weak market strength, with RSI in a bearish to neutral range, approximately at 43.24 currently, and the moving average is close to 46.94, which indicates that there is little momentum.
No prices are excessively overbought or oversold, suggesting that the market will consolidate and sell off gently and move sideways until RSI moves above 50 in the immediate future.
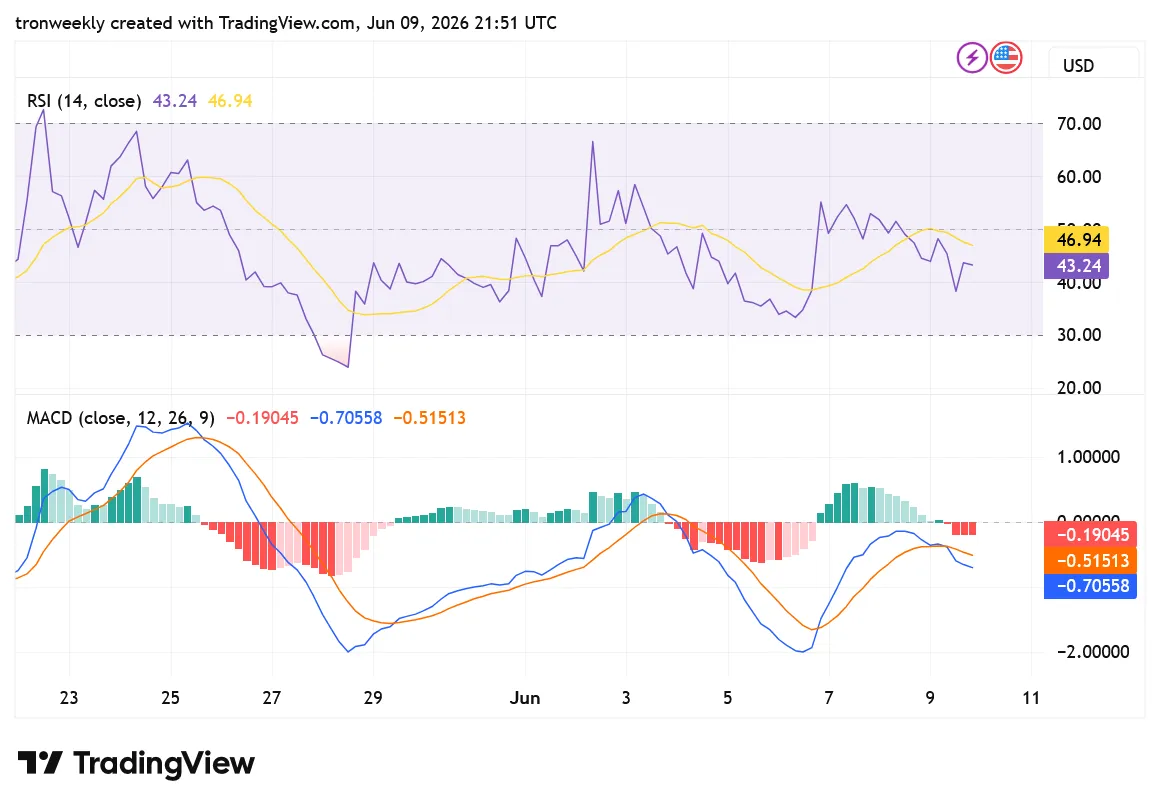
The MACD continues to remain in the bearish region. At the moment, the MACD line is at -0.70558 and is below the signal line, which stands at -0.51513, and the histogram is at -0.19045.
This indicates that there are some signs of slowdown in the negative momentum. However, there have been indications of possible reversal arising from convergence; nevertheless, it is important for a bullish cross to happen first.
Market Consolidation Likely Amid Lower Activity
According to CoinGlass data, A slight drop in volume is noticed, indicating some moderation in the levels of trading taking place. Volume drops by 1.89% to reach $33.82 million.
It may be said that there appears to be some moderation among the traders, indicating a slowdown in the ongoing trend.
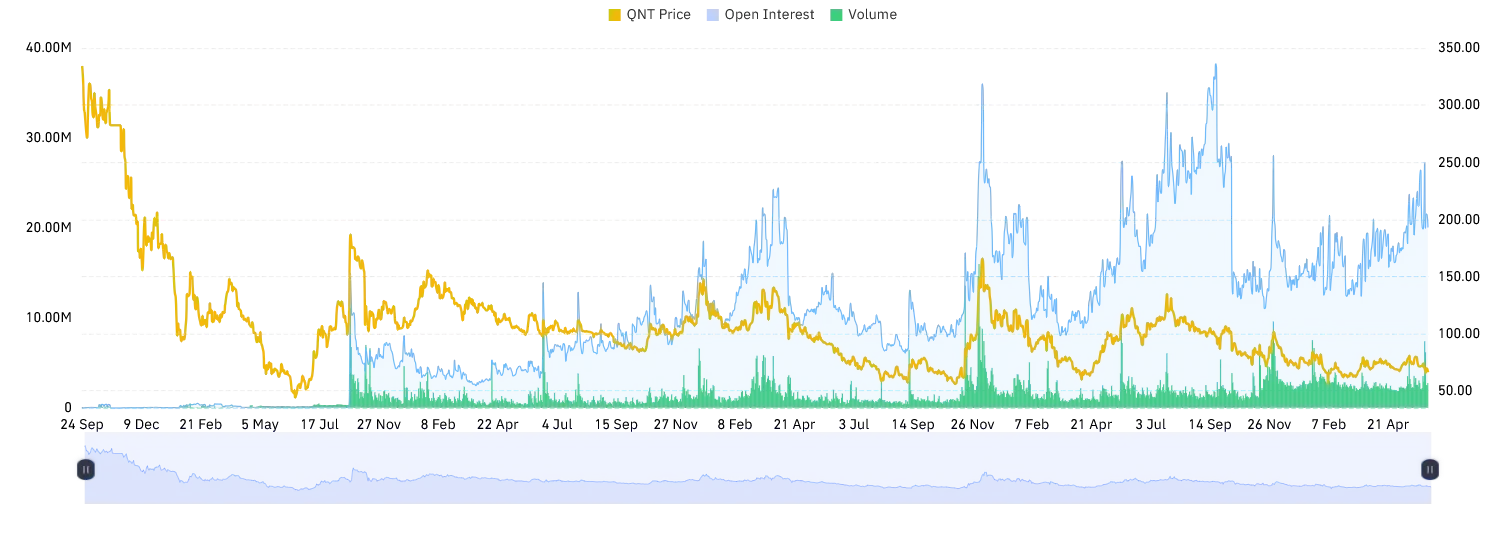
Open Interest is down significantly, which shows that traders are reducing their current positions rather than initiating new ones.
The decline of 9.57% to $18.62 million suggests reduced interest in the market. In simple terms, this indicates reduced momentum of trends in the market, with traders reducing their positions until clearer indications appear.
This article contains market analysis and price predictions. These are not guarantees. Crypto markets are volatile. Always DYOR. Not financial advice.
Also Read: QNT Price Prediction: Can It Reclaim Lost Support or Extend Losses?