
Render price analysis signals a breakout as RNDR tests wedge resistance on April 28, 2026. Analyst Profit Demon identified tightening price action, indicating a volatility expansion could follow soon.
The Render token price trades near $1.74 (per CoinMarketCap data) as derivatives data shows rising trader positioning. This setup suggests a decisive move could occur if resistance breaks with strong volume support.
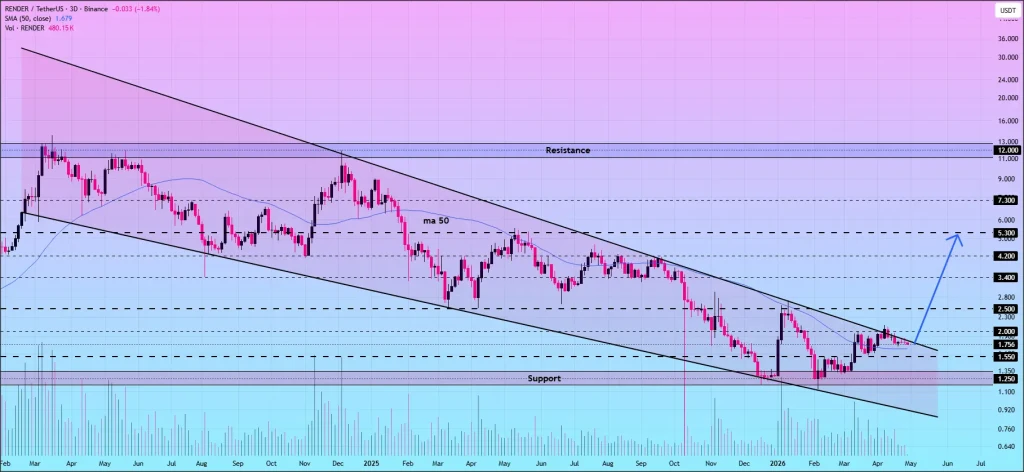
Falling Wedge Structure Builds On Breakout Pressure
A falling wedge formation for the price analysis on Render can be seen. This falling wedge formation has been forming over many months.
The falling wedge represents a bullish reversal once the upper boundary of the wedge is broken with confirmation from volumes. Render price action displays lower highs and lower lows consistently as it develops toward the apex of the wedge.
Repeated tests of the upper wedge boundary increase the probability of a successful breakout according to Profit Demon. Upon confirming the breakout, the price for RNDR should head to the target prices at $2.50, $3.40, $4.20, and $5.30.
This aligns with the broader RNDR price prediction outlook if resistance is broken. However, failure to break through the resistance will probably extend the consolidation or trigger another test on the next level of support.
The lower boundary of the wedge serves as current support and has been tested multiple times previously.
Also Read | RENDER Break Above $2 Could Trigger a Strong Rally Toward $5 Target
Derivatives Suggest No Agreement In Trader Positioning
Total liquidation has reached approximately $113,797 over the past 24 hours based on CoinGlass data. Over $105,000, which represented long positions, accounted for more than 93% of liquidations.
The recent downside volatility has removed most of the long players that were active during the last rally. Additionally, funding rates have turned positive but remain very low (at 0.0008%), showing slight signs of bullishness.
Furthermore, large negative funding rate spikes across all of the exchanges represent high levels of uncertainty regarding future price moves for the Render token price.
Open interest and trading volume surged, signaling growing speculative activity without clear directional conviction. The lack of a move up in price does suggest that most participants are still neutral and have yet to make their decisions. Current indicators show limited short-term strength despite rising derivatives activity.

Technical Indicators Show Weak Trend In The Short-Term
Despite a broader wedge shape, Trading View indicates a weak trend. The 20, 50 & 200 EMAs are closely positioned between $1.78-$1.80, acting as resistance to the Render token price.
The Render Token price continues to trade under both its moving averages. It shows no signs of breaking through the resistance levels established by those averages.
Given that RSI sits at approximately 38, it indicates some weakness in momentum with little evidence of oversold conditions. Based on the MACD, there has been a bearish crossover. Thus, downward pressure in the near term is expected.
Despite the weakness in short-term momentum, compressed prices are still in place for the Render token price.

Render Price Analysis Market Outlook
Participants must keep a close eye on the wedge resistance level as indicated by the Render price analysis. Participants should take a look at the derivative data before entering a trade.
As a result of the mixed sentiment in both spot and futures markets, participants should continue to exercise caution when participating in trades. At present, high-risk trading conditions are evident in terms of extreme volatility and potential imbalances during times of heavy liquidation.
This article contains market analysis and price predictions. These are not guarantees. Crypto markets are volatile. Always DYOR. Not financial advice.
Also Read | Ondo (ONDO) Price Stability Signals Potential Rise Toward $0.36 Target