• Skip to primary navigation
  • Skip to main content
  • Skip to primary sidebar
  • Skip to footer
  • About TronWeekly
  • Write for us
  • Terms and Conditions
  • Privacy Policy
  • Disclaimer
  • Contact
  • All Posts
  • Advertise

TronWeekly

Crypto World News

  • Home
  • Latest News
  • Opinion
    • Education
    • Best TRON Wallets
    • Beginner’s guide to TRON
    • Tron Tokens
    • Market Analysis
  • Industry
    • Tron Exchange
    • Project Review
  • Press Release
  • Bitcoin (BTC)
  • Ripple (XRP)
  • Advertise
  • About TronWeekly
    • The Team
    • Editorial Policy
    • Write for us
    • Privacy Policy
    • Disclaimer
    • Terms and Conditions
    • Contact
You are here: Home / Cryptocurrency News / Sandbox (SAND) Falling Wedge Signals Bullish Breakout Toward $1.40

Sandbox (SAND) Falling Wedge Signals Bullish Breakout Toward $1.40

What to know:

  • The Sandbox (SAND) is retesting a key falling wedge support zone, indicating a potential bullish reversal.
  • RSI near 59 and a bullish MACD crossover suggest improving buying strength despite ongoing bearish structure.
  • If bullish momentum continues, SAND could target the $1.40 level, while failure to hold support may lead to further downside.

By Mishal Ali | Edited By Messam Raza,April 4, 2026, 11:59 PM

Sandbox (SAND) Falling Wedge Signals Bullish Breakout Toward $1.40

Sandbox (SAND) is approaching a decisive moment on the weekly chart, retesting the lower boundary of a falling wedge pattern. According to the crypto analyst Butterfly, this structure, often linked to bullish reversals, is attracting strong buying interest as traders observe growing support and early signs of accumulation building beneath current price levels right now clearly.

SAND price analysis

Source: Butterfly’s X Post

If buyers continue to defend this key support zone, momentum could shift in favor of bulls, potentially triggering a breakout. Butterfly suggests that a confirmed rebound may drive SAND toward the $1.40 region, aligning with prior resistance. 

However, failure to hold this level could invalidate the setup and expose the asset to further downside pressure.

Also Read: The Sandbox (SAND) Analysis: Short-Term Drop, $0.0934 Target Ahead

SAND Technical Outlook Reveals Cautious Optimism

According to TradingView, SAND shows an ongoing downtrend in late March, with lows that are consistently lower than before. 

With the price now hovering around 0.07766, there is a clear indication of the 200-period EMA barrier sitting at 0.08073, which is serving as robust resistance for the coin. This comes after a strong downtrend towards support.
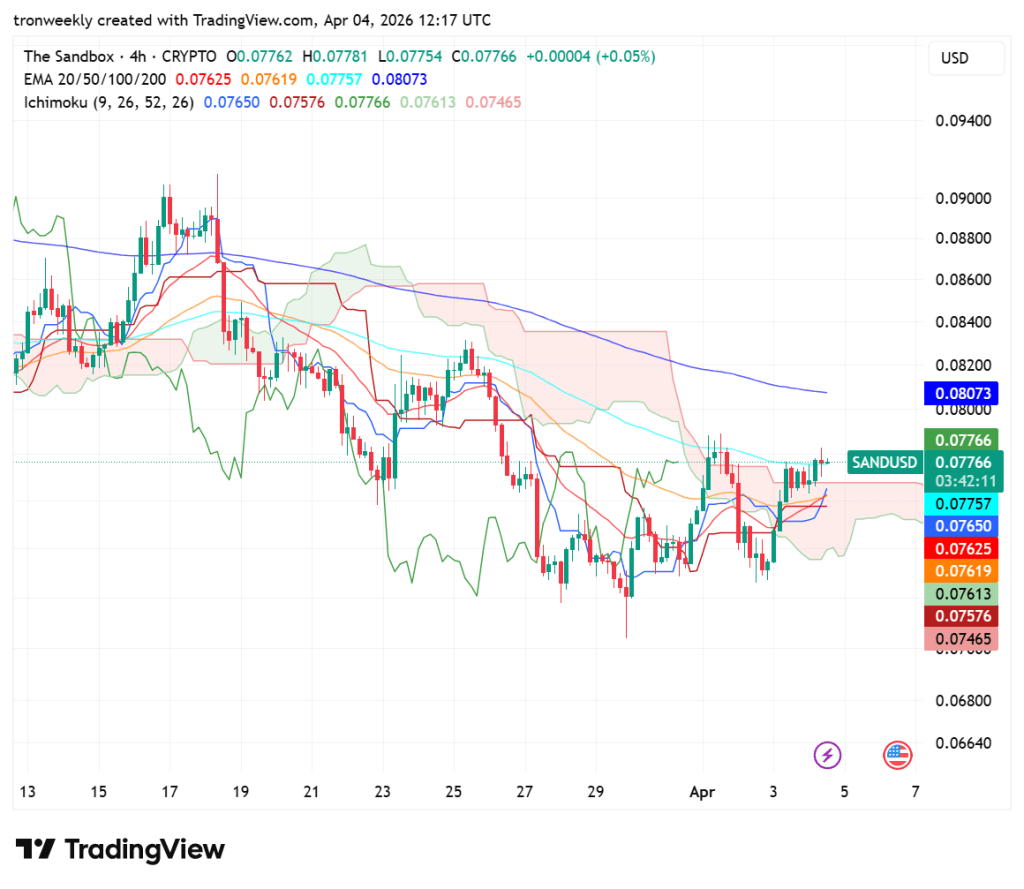
SAND price analysis

Source: TradingView

The Ichimoku Cloud indicates that there is neutrality in the market since the price action is confined to the Kumo. 

The EMAs for the shorter-term periods appear to be bunching up for a possible squeeze play, but the Chikou Span still suggests persistent bearish forces at work. It would take a move above the 0.08100 level to change the direction.

Momentum Indicators Support Upward Potential

The value of RSI (14) is at 59.33, indicating that it lies within the positive range of neutral to bullish conditions.

As the indicator is still below the 70-point overbought condition, there is plenty of scope left for growth. The indicator is moving upwards relative to the yellow line, indicating that buyers are gaining control over sellers.

SAND price analysis

Source: TradingView

The MACD indicator exhibits a positive crossover as the blue line moves higher than the orange one. The momentum is moving in a positive direction as the green bars in the histogram are widening. 

While both lines have not moved significantly away from the zero level, the fact that they are moving up implies that the current uptrend is getting stronger.

This article contains market analysis and price predictions. These are not guarantees. Crypto markets are volatile. Always DYOR. Not financial advice.

Also Read: Can SAND Break $0.0894? Indicators Show Early Bullish Momentum

Filed Under: Cryptocurrency News

About Mishal Ali

Mishal Ali is a Policy and Regulations Reporter at Tron Weekly with over four years of experience covering the global crypto and blockchain space. Her reporting focuses on crypto regulations and policy, alongside Bitcoin, Ethereum, altcoins, DeFi, NFTs, Web3, Layer 2 solutions, and AI-driven crypto use cases. She also tracks Ripple-related developments, enforcement actions, licensing updates, and crypto scams and fraud trends, helping readers understand regulatory and compliance risks.

🔗 Connect on LinkedIn

Twitter LinkedIn

Primary Sidebar

Recent Posts

  • DASH Price Accumulation Signals Potential Breakout Above 2021 High May 20, 2026
  • JASMY Price Prediction: Fractal Setup Hints at a Rally Toward $0.055 May 20, 2026
  • NEAR Price Analysis: Strong Breakout Above $1.60 Fuels Hope for a $2 Rally May 20, 2026
  • ALGO Price Prediction: Consolidation Phase Hints at Potential Rally to $0.15 May 20, 2026
  • Dogecoin Price Signals Repeat Cycle Structure With $2 Long-Term Target in Focus May 20, 2026

Footer

News

  • Latest News
  • Altcoin News
  • Bitcoin (BTC)
  • Blockchain
  • Tron (TRX)
  • World

Digest

  • Meet the Founder
  • Price Winning Article
  • DeFi
  • Cyber Security
  • Crypto Scam

Industry

  • Project Review
  • Technology
  • Fintech
  • Tron Exchange
  • New in Town

Tron Universe

  • Event and Tron Parties
  • New in Town
  • Tron Tokens

FOLLOW US

  • Facebook
  • Telegram
  • Twitter
  • Linkedin

Editorial Policy | Privacy Policy | Disclaimer | Terms and Conditions | Masthead

Copyright © 2026 · Tron Weekly. All Rights Reserved. NOTE: Tron Weekly is an independent crypto news site that adheres to the strict journalism policy anchored on transparency, trust, and objectivity, we have no affiliation with the TRON Foundation, its founder Justin Sun or any other cryptocurrency firm.