• Skip to primary navigation
  • Skip to main content
  • Skip to primary sidebar
  • Skip to footer
  • About us
  • Write for us
  • Terms and Conditions
  • Privacy Policy
  • Disclaimer
  • Contact
  • All Posts
  • Advertise

TronWeekly

Crypto World News

  • Home
  • Education
    • Best TRON Wallets
    • Beginner’s guide to TRON
  • Opinion
    • Tron Tokens
    • Market Analysis
  • Industry
    • Tron Exchange
    • Project Review
  • Press Release
  • Advertise
  • About us
    • The Team
    • Editorial Policy
    • Write for us
    • Privacy Policy
    • Disclaimer
    • Terms and Conditions
    • Contact
You are here: Home / News / Shiba Inu drops to the 11th rank as price remain bearish
Shiba Inu

Shiba Inu drops to the 11th rank as price remain bearish

November 12, 2021 by Parth Dubey

Shiba Inu’s growth showed no signs of stopping last month as it continued to conquer the charts. However, the month of November hasn’t been quite great for the token as prices are down by more than 20%, reaching a monthly low of $0.00004312. Furthermore, the SHIB token dropped by more than 15% on the week ending Nov 1.

As per the data from CoinmarketCap, the 24-hour trading volume of SHIB dropped by 31.75% and is currently at $4.2 billion. Also, the market capitalization of the token declined by 10.79%, resting at $28 billion. The 24-hour high of the token was witnessed at $0.00005705 and low at $0.00005161.

The price movements in the recent days have been quite bearish as Bitcoin retests $64k. The nearest resistance for SHIB price action remains unbroken at $0.00007811, while support levels can be found at $0.00005146.

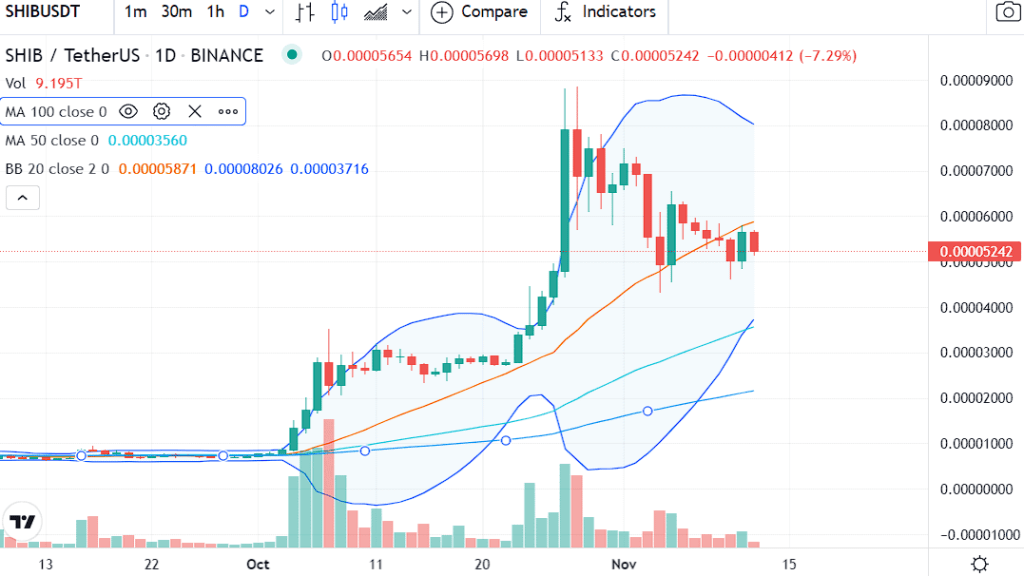
Shiba Inu price analysis using the daily chart

The technical indicators on the daily chart indicate that the momentum is shifting from bullish to bearish as the price of the coin enters the bearish side of the Bollinger Bands. We can expect a breakout from the lower end if this price fractal continues.

Although, the 50-day and 100-day Moving Averages are still below the price action, which is a bullish scenario, indicating that bulls might take over once volumes are high.

image 16
Shiba Inu price analysis on daily chart by TradingView

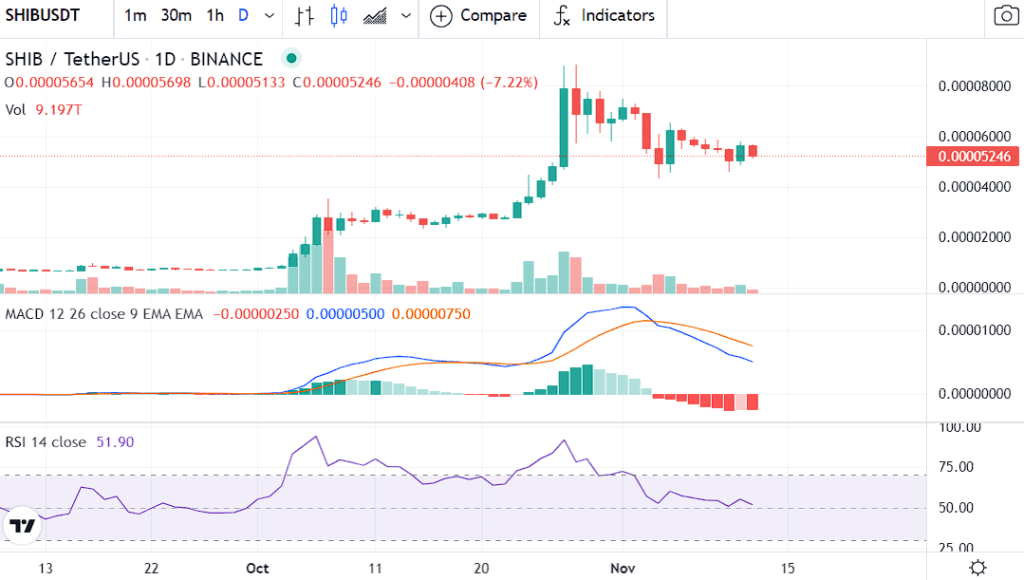
On the other hand, the MACD indicator shows that the signal line (orange line) has crossed above the MACD line (blue line), and the histogram on the chart has turned bearish, filled with red bars. This indicates a bearish crossover, and lower prices for the short term are possible.

Also, the RSI indicator is progressing with a negative gradient, hinting at bearish price action as selling pressure is defeating the buying pressure.

Shiba Inu
Shiba Inu price analysis on daily chart by TradingView

Final Verdict

The meme coin’s performance appears to be bearish in the short term, and it seems that lower prices will follow if buying pressure doesn’t increase. Volumes seem to be optimistic; however, price action remains sluggish.

Filed Under: News, Altcoin News Tagged With: Shiba Inu Coin

Primary Sidebar

Recent Posts

  • Litecoin’s Confidential Transactions Lead to Warnings by Korean Exchanges May 24, 2022
  • The Intruder Who Visited Do Kwon’s Home Speaks to the Public May 24, 2022
  • eBay teams up with OneOF to release the first-ever “Genesis” NFT collection May 24, 2022
  • Gafisa, Brazil’s Real Estate Giant Embraces Bitcoin May 24, 2022
  • Crypto Lottery: Winner Takes All May 23, 2022

Footer

News

  • Altcoin News
  • Bitcoin News
  • Blockchain
  • Tron News
  • World

Digest

  • Meet the Founder
  • Price Winning Article
  • DeFi
  • Cyber Security
  • Crypto Scam

Industry

  • Project Review
  • Technology
  • Fintech
  • Tron Exchange
  • New in Town

Tron Universe

  • Event and Tron Parties
  • New in Town
  • Tron Tokens

Follow Us

Subscribe US

Copyright © 2022 · Tron Weekly. All Rights Reserved. NOTE: Tron Weekly is an independent crypto news site that adheres to the strict journalism policy anchored on transparency, trust, and objectivity, we have no affiliation with the TRON Foundation, its founder Justin Sun or any other cryptocurrency firm.