- Solana is testing critical Fibonacci levels, suggesting potential price reversal at key support zones.
- A falling wedge pattern signals bullish momentum, with breakout targets at $204.31, $229.01, and $258.45.
- RSI at 43.17 indicates neutral sentiment, while MACD shows bearish momentum; watch for breakout confirmation.
Solana is entering a critical Fibonacci retracement point, which indicates a possible price reversal in the market. Analyst Rose Premium Signals highlighted that SOL is now trading within the Fibonacci levels of 0.618 and 0.786, which are historically very strong support levels. This area has been known to cause significant price action, giving traders a chance to take action based on a possible breakout. The chart also indicates bullish momentum and may have an upside price movement.
The SOL chart shows a falling wedge formation, and the falling wedge is usually regarded as bullish. This pattern would imply an accumulation process or accumulation of purchasing pressure around supporting levels. When the price gets close to the lower border of the wedge, it may be preceded by a breakout or an upward move. This presents a perfect situation of traders going long, especially in the price range of $128 to $140, with a possibility of profit-making. As of press time, Solana is currently trading at $148.79.

Source: X
Solana Price Movement Potential
The analyst has determined certain target points for Solana in the case of a breakout. The initial target is a price of $204.31, another target of $229.01, and the final target is a price of $258.45. These levels are regarded as attainable provided that SOL overcomes the existing resistance and encounters support levels along the Fibonacci area. A successful breakout may result in the immediate increase of the price to these target levels.
The Relative Strength Index (RSI) measure of Solana is 43.17, showing that the market is neutral. RSI assists in identifying both overbought and oversold assets, whereby a reading above 70 indicates an overbought asset, whereas a reading below 30 indicates an oversold asset. Solana has an RSI value of 43.17, making it neutral in terms of market bullishness and bearishness. This indicates that the asset is consolidating and awaiting a major movement or trigger.
Bearish MACD Momentum
The MACD indicator indicates a bearish momentum on Solana. The MACD line is positioned at -3.33, indicating downward pressure on the market. The histogram also demonstrates decreasing market strength. The blue MACD line is also below the red signal line, which is a common indication of a bearish mood. Nonetheless, with such indications, the market may turn in the opposite direction if the Fibonacci support level is broken, leading to a drastic change in the trend.
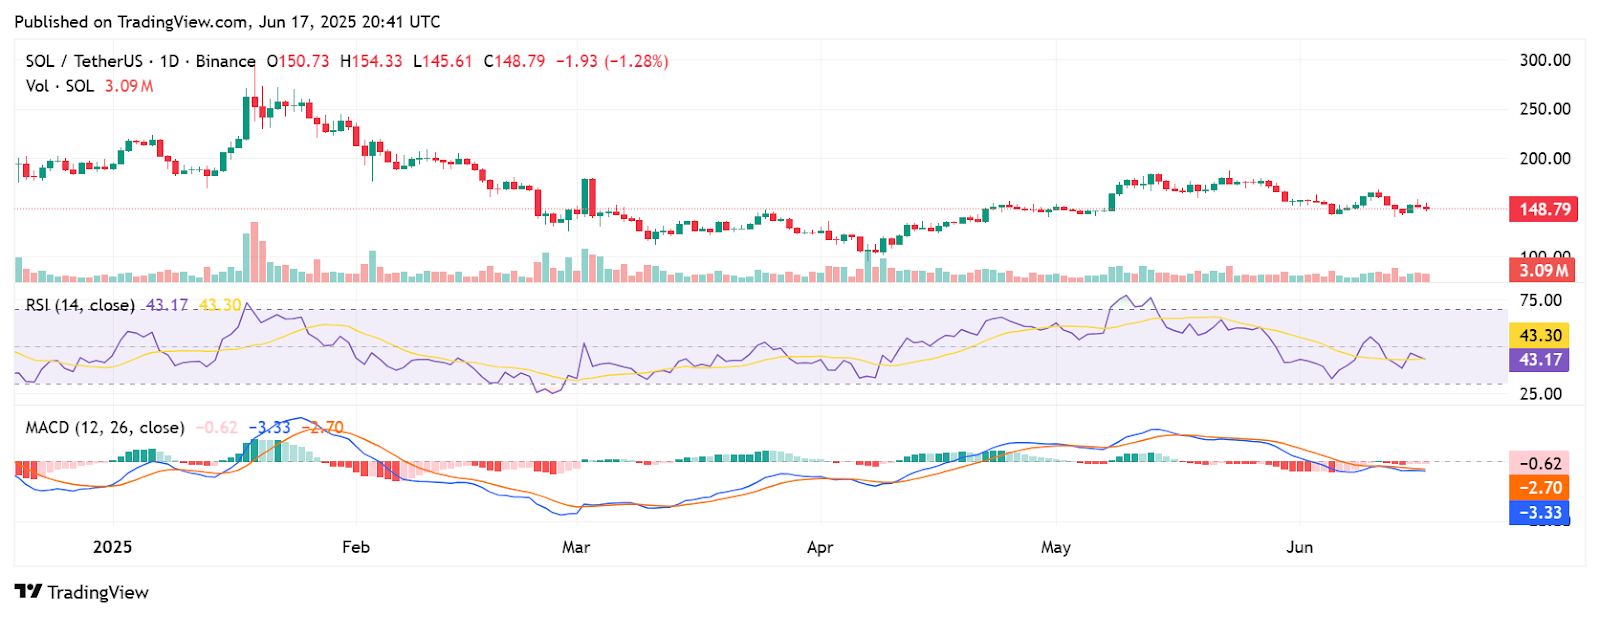
The price action of Solana is testing major Fibonacci levels, and it has a long side of the opportunity. The RSI is neutral, and the MACD bears bearish momentum, but there is a possibility of a bullish reversal because of the falling wedge chart pattern and the strong support levels. The confirmation of a breakout in the $128 to $140 range should be monitored, and the target should be seen at the levels of $204.31, $229.0,1, and $258.45
Related Reading: Dogecoin Battles Resistance, Powerful Breakout Toward $0.20 Gains Momentum