
Solana is currently experiencing sideways movement, reflecting a balance between buying and selling pressure in the market. While short-term momentum shows early signs of recovery, the asset remains confined within a defined range. Analysts suggest that upcoming price action will be crucial in determining its next trend.
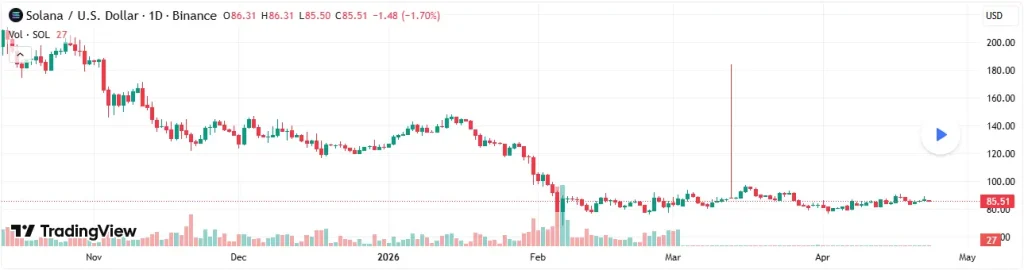
Solana is showing mixed price action in the crypto market today as it continues to trade inside a tight range. The asset is currently priced at $86.06, reflecting a slight 0.44% decline over the last 24 hours. On the positive side, the asset shows high levels of activity with a 24-hour trading volume of $4.49 billion. At the same time, the asset’s market capitalization stands at $49.56 billion, accounting for 1.91% of the entire cryptocurrency ecosystem.

Also Read | Ethereum Price Analysis Signals Bullish Divergence at $2,300
Solana Consolidation Hints at Potential Breakout Ahead
Over the past few sessions, SOL price has been trading within $75-$91 support and resistance level during the last several sessions. Currently, the price hovers in between the boundaries of the range, indicating a consolidation phase as market structure slowly improves.
A well-known crypto analyst, Diane DeCrypt, recently highlighted Solana’s past cycle performance, where it surged nearly 26 times from around $8 to $295. With regard to its future potential growth, it pointed to the bottom formation near $70, saying that the Solana price might grow even further. In other words, if it follows the same trajectory, the asset could potentially reach $1,800, if we talk about a half-cycle scenario, Solana’s price should be around $900-$1,000.

Solana Technical View Eyes Breakout Above $91
From a technical point of view, there is a certain milestone near the Solana price. A confirmed breakout above $91 should provide more upside targets at $100.00, $107.40 and $125.00.
If the price fails to hold current strength and falls back below $75, the picture could change. In this case, the price would be aiming for $68.75 and $62.50.
Technical indicators are showing early signs of recovery. The MACD is turning positive, Bollinger Bands are slowly curling upward, and the Stochastic indicator is attempting to rise again. These signals suggest that upward pressure is slightly stronger for now, but confirmation is still required.
Overall, SOL is trading within a very interesting range, and the next sessions could show whether it breaks above the resistance or falls below the support level.
Also Read | Bitcoin Cash (BCH) Ascending Triangle Suggests Possible Surge Toward $1200