Solana (SOL) price maintains stability at an important level of resistance following a period of recovery after a previous drop in price. Based on the current price setup, it is clear that there may be a bullish trend for the asset in the coming periods, depending on whether it manages to break out into new territory.
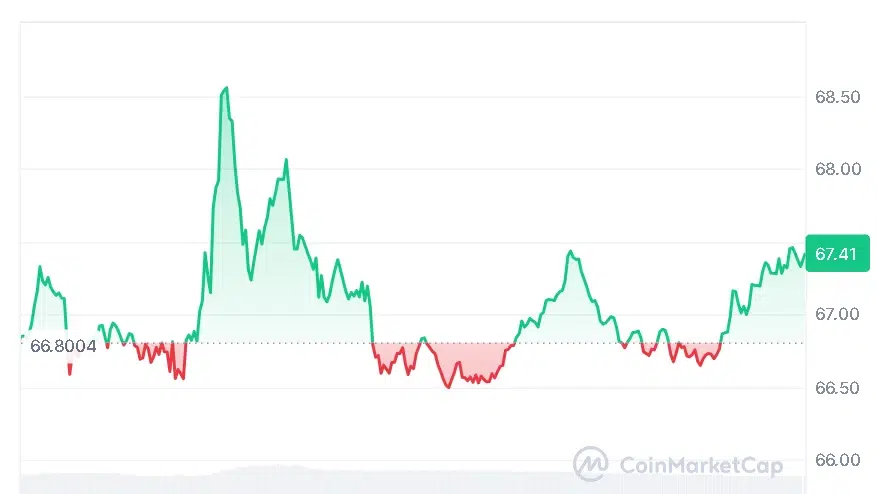
At the time of writing, SOL is trading at $67.41, marking a 0.97% increase over the last 24 hours. The asset continues to maintain solid activity levels, supported by a 24-hour trading volume of $4.52 billion and a market capitalization of $39.11 billion, according to CoinMarketCap.
Also Read | ALGO Price Prediction: Can Bulls Break $0.096 Resistance Level?
Solana Price Technical Structure Signals W-Shaped Recovery
According to the analysis from crypto analyst Alpha Crypto Signal on June 13, 2026, it can be seen that there is a formation of a W bottom reversal shape in the 4-hour chart, as the coin continues to hold its previous support area in terms of Solana price.

But currently, Solana price action is getting closer to the crucial resistance range at $67-$68. This range is highly important because it may become the key driver in the following move.
Based on the technical analysis, in the case where Solana price manages to overcome the level of $67-$68 resistance, there is a probability that the asset might be able to convert it to support. This would mean that a further growth wave will be possible.
However, in case the Solana price does not break through this resistance level, then the market could be stuck in a sideways move while trying to establish its direction. Therefore, it becomes significant at this point in time.
Derivatives Data Shows Mixed Signals Around Solana
Analysis of market derivatives suggests a combination of elements in relation to the Solana price action. There has been a decline in trading volume by 13.90% at $6.24 billion. On the other hand, open interest is up by 0.73%, amounting to $4.61 billion.
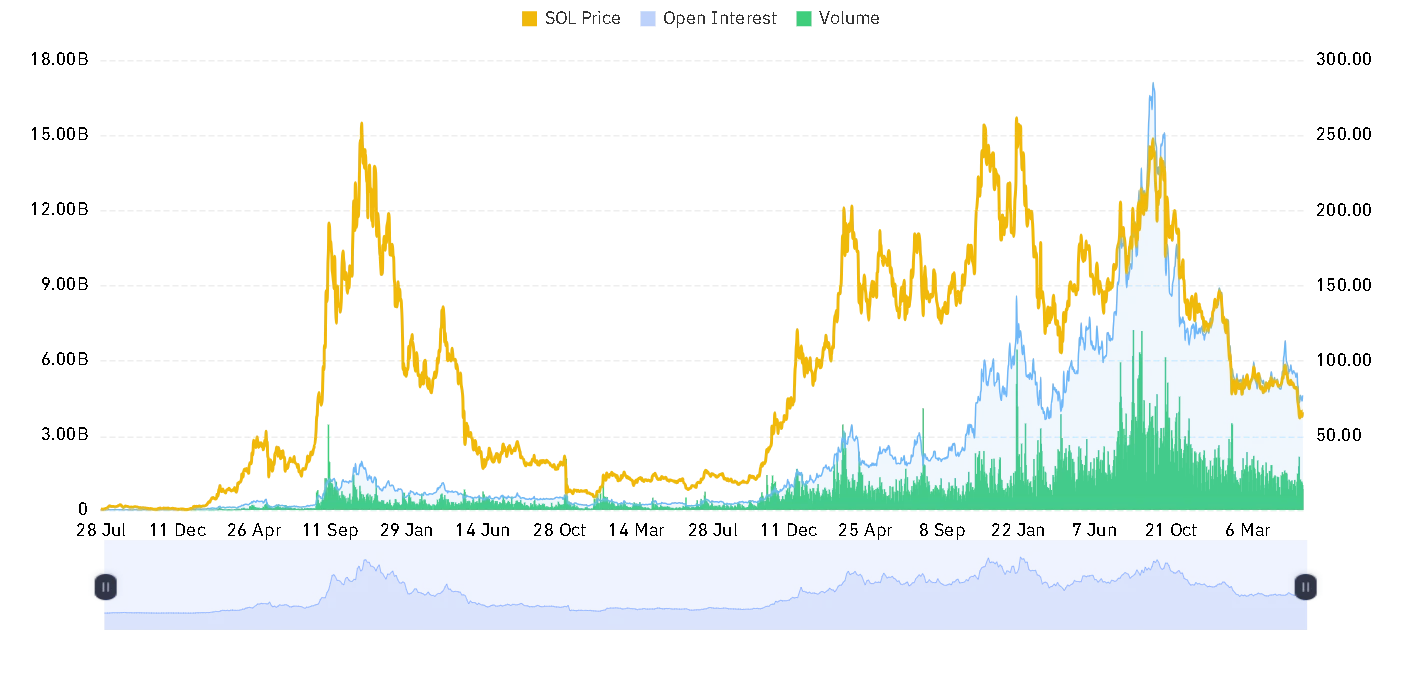
The open interest weighted indicator stays close to neutral at 0.0002%. It means that there is a balance between long and short positions; there is no evident directional bias. In general, the dynamics regarding Solana price indicate a neutral attitude towards the asset.

This article contains market analysis and price predictions. These are not guarantees. Crypto markets are volatile. Always DYOR. Not financial advice.
Also Read | Chainlink Price Forecast: Can Expanding Prediction Markets Push LINK Toward $9.20 by June End?