Solana (SOL) is showing renewed bullish momentum after breaking above a long-term descending trendline. The breakout has strengthened its recovery outlook, while strong network activity and elevated derivatives positioning are adding further interest around the Solana price as traders watch for continued upside momentum.
Table of Contents
Solana Breaks Above Multi-Month Downtrend
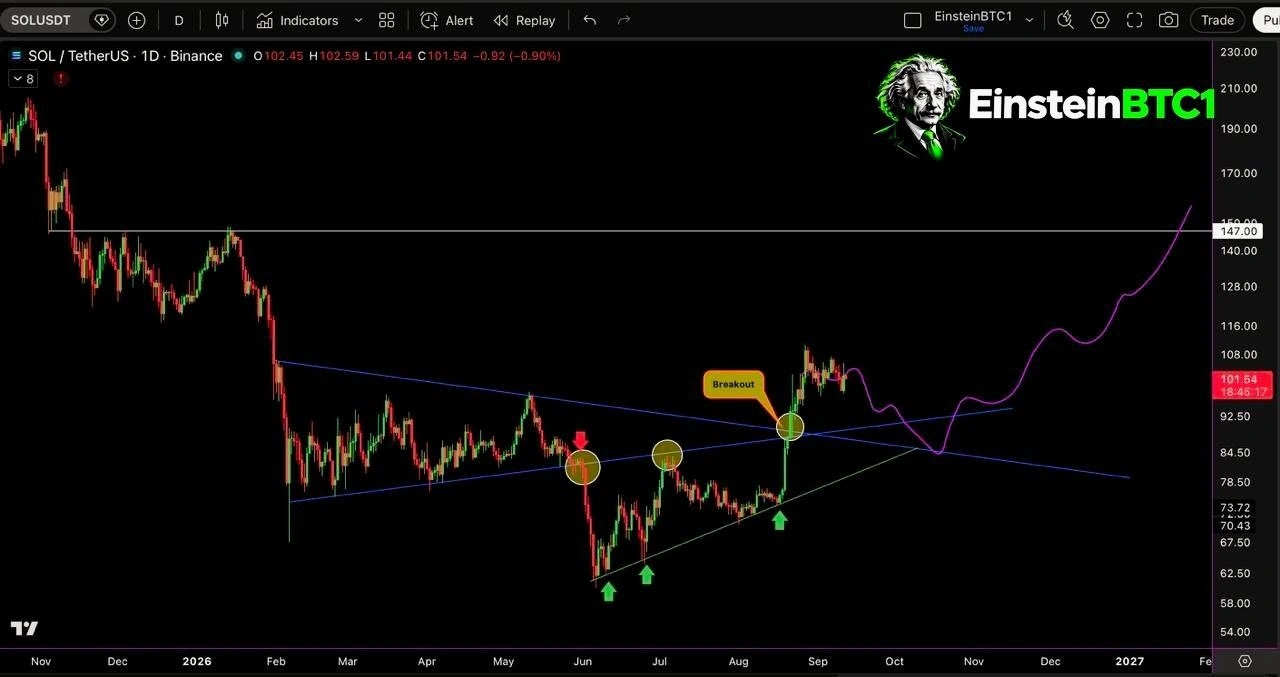
Solana (SOL) is showing renewed bullish momentum after breaking above a multi-month descending trendline on the daily chart. Crypto analyst Einstien highlighted the breakout, identifying the $92 area as the next major test for the asset.
Source: Einstein’s X Post
According to the analyst’s setup, SOL could follow a potential sequence of a $92 retest and hold before moving toward $108, $128, and eventually $147. These levels represent projected resistance and upside targets rather than guaranteed price outcomes.
The rally follows Solana spending the majority of July and August trading in an extended period of low-volatility accumulation within a roughly $74-to-$78 price range. This period of extended consolidation finally culminated in a swift run to new highs above $90, eventually making its way towards $107.
With the movement from extended consolidation into decisive breakout, there is increased confidence that Solana’s market structure may be changing due to several months of bearish pressure.
Also Read: Solana Price Eyes $140 as Bull Flag and Institutional Buying Strengthens Outlook
Solana Key Support at $92 Becomes Critical
The level of $92 is now significant from a technical standpoint for Solana. The breakout above the downtrend line is followed by a test of former resistance levels, which could serve as solid support and help form the basis of the next move higher.
If buyers defend the level on a daily closing basis, attention could shift toward the $108 region, which sits close to the recent breakout high. A sustained move above that area could then expose higher projected targets around $128 and $147.
But the configuration is still vulnerable to any support breakdown. A lower close on a daily basis below the level of $92 would invalidate the breakout scenario and suggest that the current rally lacks strength to create a trend reversal.
Solana Price Holds Above Key Moving Averages
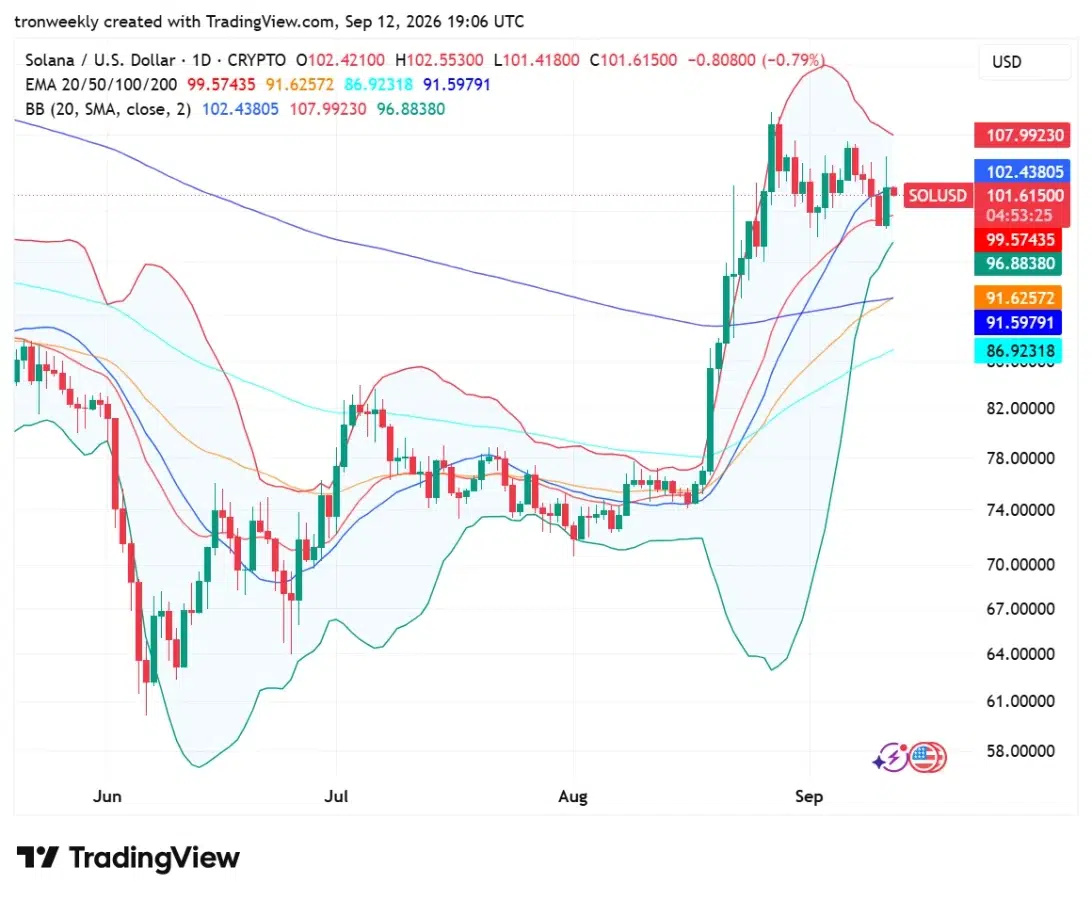
TradingView chart data also shows that SOL has a positive technical setup. The token is currently trading above a few significant exponential moving averages, such as the 20 EMA of $99.57, 50 EMA of $91.63, 100 EMA of $86.92, and 200 EMA of $91.
Source: TradingView
The placement of these averages gives various stages at which SOL could find support in case of a temporary retreat. The 50 EMA and 200 EMA lines are very crucial since both are near $91-$92 mark, very close to the re-test level suggested by the analyst.
However, Bollinger Bands show that there is more volatility after the August move. Now, the upper band at $107.99 serves as an important resistance zone, while the 20 EMA acts as a significant dynamic support zone.
Falling Volume Meets Rising Open Interest
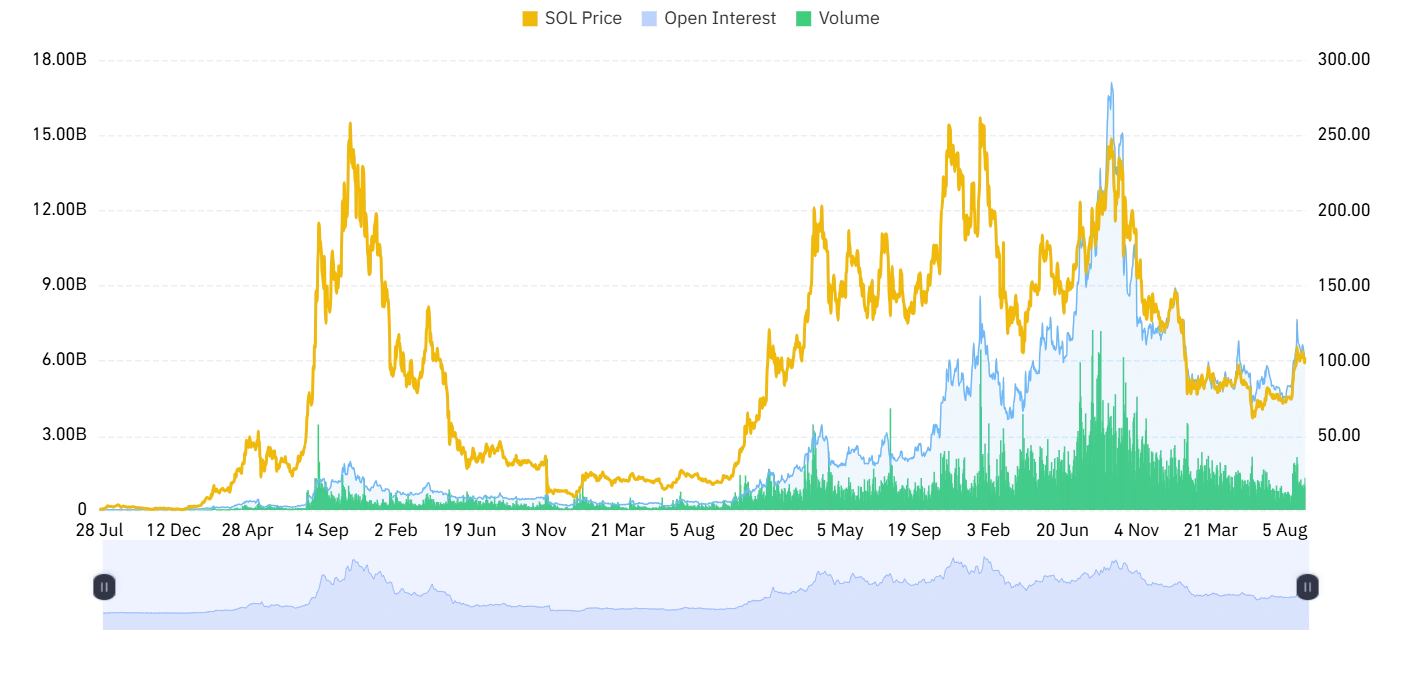
Despite the bullish price structure, derivatives data indicates a more conservative signal. As per Coinglass, the 24-hour trading volume of Solana has fallen 55.31% to around $4.35 billion.
Source: Coinglass
Meanwhile, open interest rose 1.65% to reach $6.05 billion. Such a discrepancy implies that the position in derivatives is still high despite the general decrease in trade volume.
This could be an indication of increasing leverage in the market, and it might help cause volatility in prices if SOL nears key support or resistance levels. It is important for traders to pay attention to whether the rising open interest comes with increased spot demand.
Solana Network Activity Adds Another Catalyst
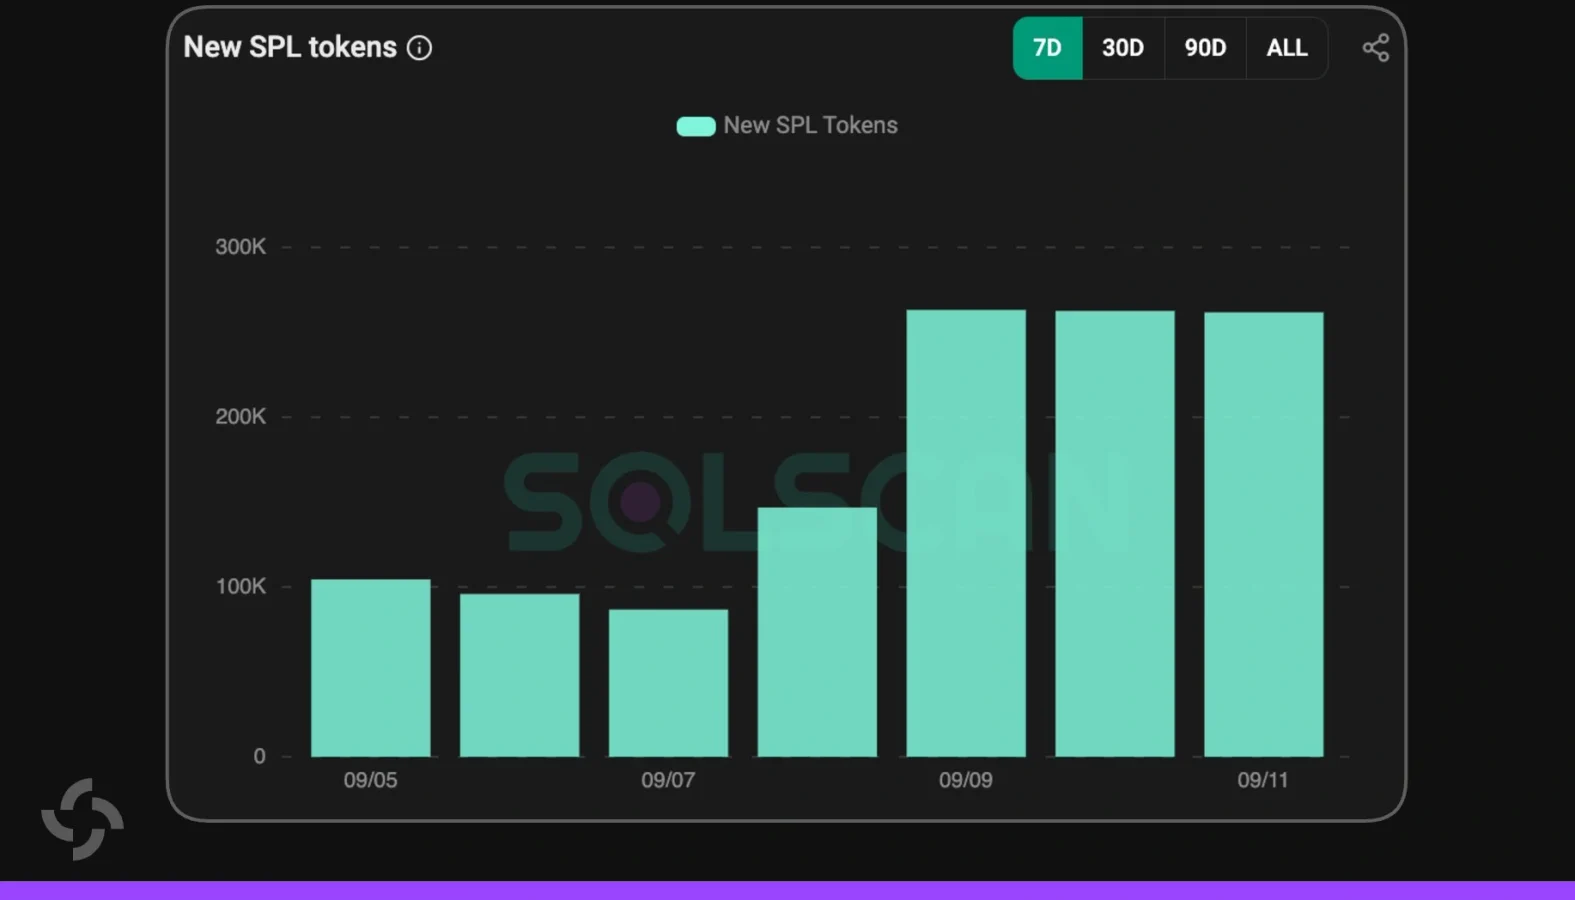
Apart from price action, the level of network activity on Solana is also remarkable. According to data provided by Solana Floor, more than 260,000 tokens were launched daily over three days straight.
Source: Solana Floor’s X Post
A continued token minting is indicative of the sustained activity within the Solana ecosystem. Although the high launch activities do not necessarily indicate any price appreciation in the SOL, it serves as an indication of continued engagement within the ecosystem.
For SOL, the following important test will be the $92 retest. Sticking to that level can confirm the breakout, thus keeping the $108, $128, and $147 targets relevant, while failure to do so can undermine the present bullish formation.
Also Read: Solana Price Eyes $140 as Bull Flag Signals Potential Breakout
This article contains market analysis and price predictions. These are not guarantees. Crypto markets are volatile. Always DYOR. Not financial advice.