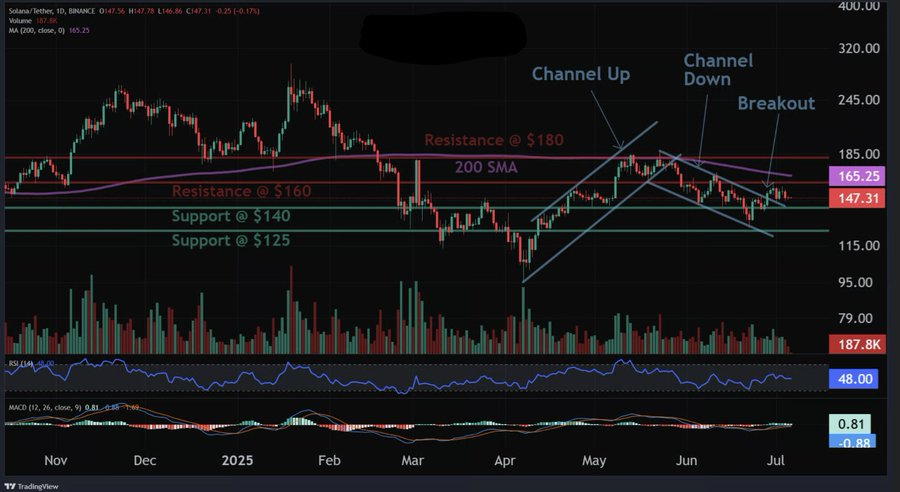
- Solana breaks out of falling channel, targeting $160 to $167 with short-term upside potential.
- Trading volume surges 49.4% to $2.58 billion as market activity and interest in Solana increase.
- Analysts warn that the trend remains bearish despite the breakout, key support lies at $140 and $125.
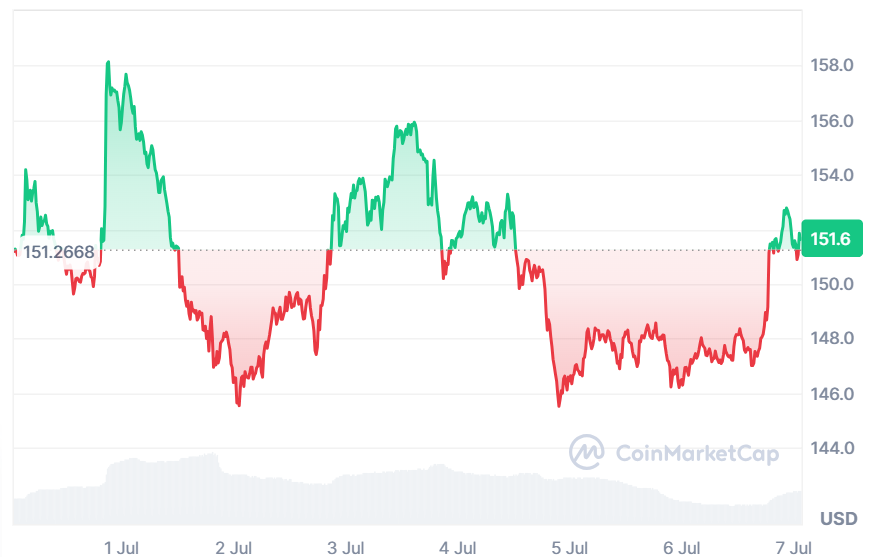
Solana is trading at $151, marking a modest increase of 3.19% over the past day. The trading volume for the same period stands at $2.58 billion, representing a 49.4% increase. Over the past 7 days, the Solana coin has increased by 0.38%. Nevertheless, technical signals point to a possible change of trend.
Source: CoinMarketCap
CoinCodeCap highlighted an upsurge out of the falling channel. Their optimism is short-term at the level of the upper $160 to $167 region. This presents a possible 10% accrual. Nevertheless, the movement is contrary to the wider trend. The pattern is bearish in the short, medium, and long terms. Analysts suggest setting a stop-loss at $136. Critical resistance positions are at the levels of $140 and $125. The two resistance levels are at $160 and $180.
Source: X
Also Read: Massive Solana Whale Transfer Unfolds: Is a SOL Surge Incoming?
Bullish Momentum Signals
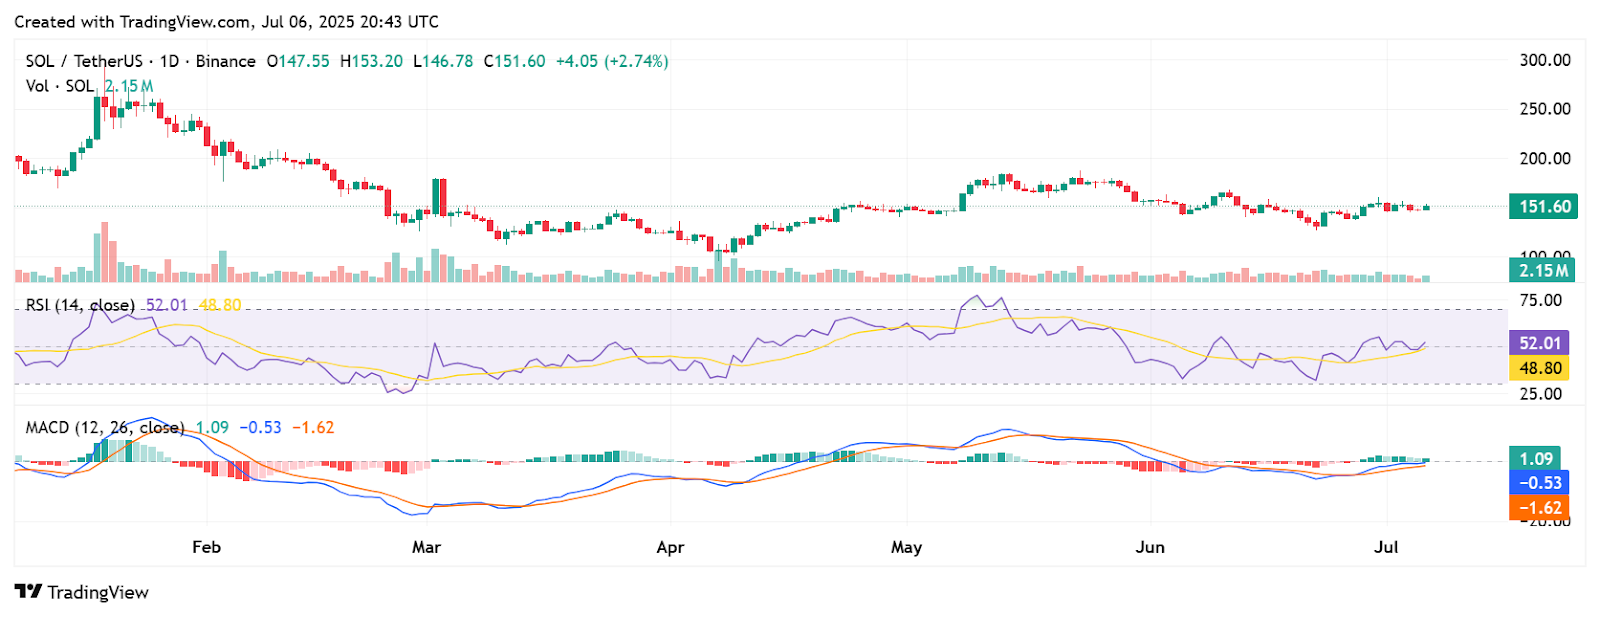
The Relative Strength Index (RSI) stands at 52.01. It has exceeded the 50-level of neutrality. This indicates that a minimal bullish trend is developing. The RSI moving average is 48.80. The indicator indicates that buyers are coming back. The push over 60 would indicate more trend confirmation.
Source: TradingView
The MACD line stands at 1.09, and the MACD signal line at -0.53. There is a bullish crossover. But the histogram is becoming narrow. It is an indication of a deteriorating bullish flow. The MACD trend is positive however, it needs more volume in order to sustain it. The traders are advised to be careful.
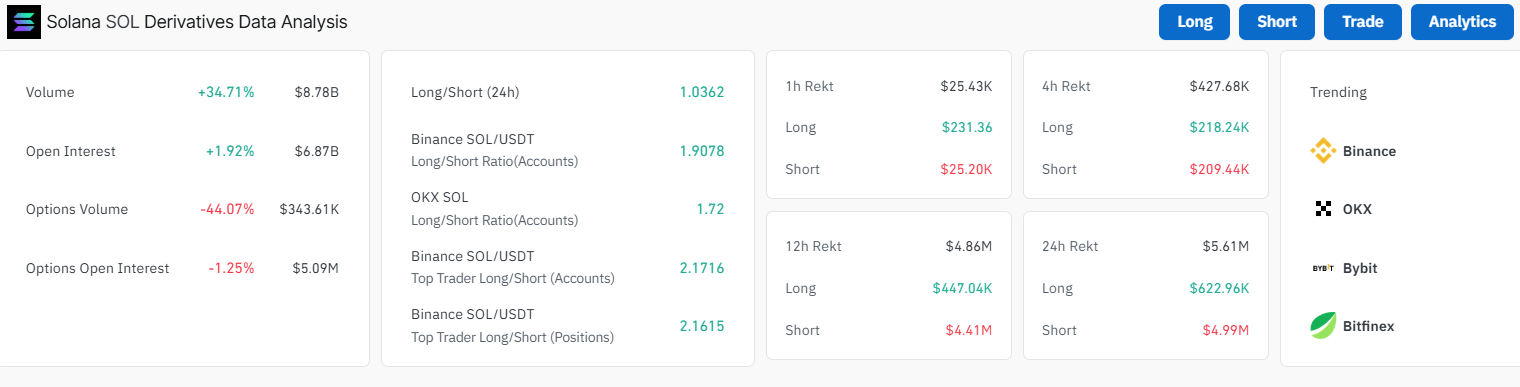
CoinGlass data shows an increase in market activity. The trading volume grew by 34.71% to $8.78 billion. The open interest increased by 1.92% to $6.87 billion. These figures demonstrate more active trader activities. It confirms the fact that the breakout has caught attention. However, the trend might not be supported solely by volume unless it is followed up by buying.
Source: CoinGlass
Solana Nears Key Breakout
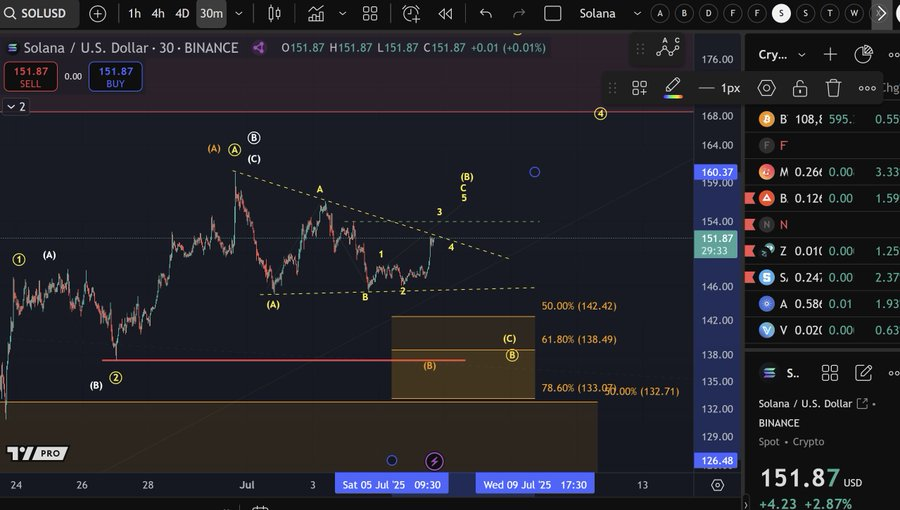
More Crypto Online revealed that it is following a current triangle formation. He believes that the current rally is part of wave (B) of a corrective pattern. Only three waves have been formed as yet. This suggests that the relocation might not be hasty. Nevertheless, there is no extreme selling pressure. That argues in favor of a significant low coming about on the June 22 low.
Source: X
The Solana is experiencing pre-recovery. The breaking out and increasing RSI are an indication of a possible reversal. However, a decrease in the MACD indicates a lack of momentum. The technical configuration is bullish unless attested. Traders should monitor a daily close above $160 as confirmation. Meanwhile, there is still a doubtful trend, so it is important to be careful.
Also Read: Solana Price Analysis: Can SOL Hit $180 After Technical Breakout?