
- Stellar is still following a bearish sentiment on a long-term outlook despite the current price increase
- If the $0.09 rejects buying pressure, Stellar’s price may fall back to immediate support
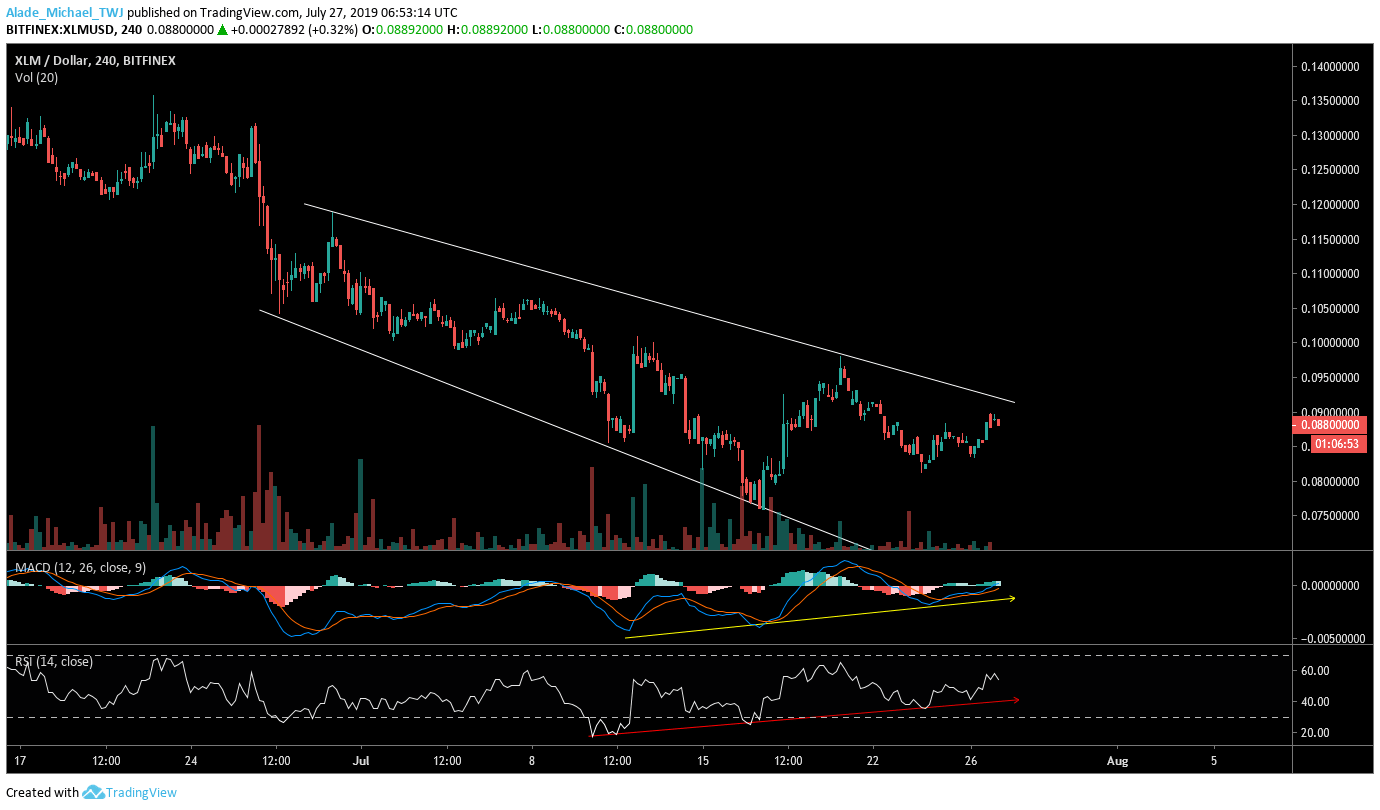
- The technical indicators are turning bullish, XLM may witness a break-up the broadening descending wedge
The entire crypto market has seen a significant correction as a result of Bitcoin’s price recent drop. It made most of the top cryptocurrency projects to bolster on medium-term support for the past few days now, including Stellar (XLM) which has been following a broadening descending wedge pattern on the 4-hour chart.
Over the past 24-hours of trading, the bulls have shown a little commitment to the XLM trading with a price increase of about 4.42%, bringing the price of the Stellar near the $0.09.
Stellar’s Current Statistics
Trading Price: $0.088
Market Capitalization: $1,725,171,607
Trading Volume: $113,010,029
Key Resistance Levels: $0.096, $0.10, $0.106
Key Support Levels: $0.084, $0.0815, $0.076
Stellar Price Analysis for July 27, 2019
The short-term outlook has projected a downward movement for the XLM market over the past few days. Technically, the market is reaching the upper wedge resistance on the 4-hour time frame where the market is likely to witness a price rejection. On the other hand, a break-out is also likely.
On the hourly chart, Stellar is currently trending in a symmetrical triangle pattern with a potential surge in volatility. Considering a northward movement, the $0.096, $0.10 and $0.106 may provide resistance for the market. Alternatively, a southward direction could fall the price back to $0.084, $0.0815, and $0.076 supports.
From a long-term perspective, the XLM/USD pair is still in a bearish trend following the recent bloodbath which is still quite fresh on the intra-day trading along with the technical RSI – MACD indicators which are reading contrary at the moment.
Conclusively:
While the Stellar (XLM) market remains in a bearish trend, we may need to consider a breakout on the hourly time frame where the market currently follows a symmetrical triangle formation. If a price break fails to occur, the market will continue to respect the descending broadening wedge on the 4-hour time frame, as shown in the above chart.
Technical Indicator Reading
While following the rising yellow line, MACD moving average is currently testing the zero level as it waits for a possible break up. A rejection will lead to a bearish turn.
RSI has continued to trend in higher highs and higher lows pattern for Stellar (XLM) as it further finds support on the red rising trend line. Following the recent positive sign, the indicator will continue to go up if the buyers can sustain the pressure further.
Disclaimer: The presented information is subjected to market condition and may include the very own opinion of the author. Please do your ‘very own’ market research before making any investment in cryptocurrencies. Neither the writer nor the publication (TronWeekly.com) holds any responsibility for your financial loss.
Never miss our daily cryptocurrency news, price analysis, tips, and stories. Join us on Telegram | Twitter or subscribe to our weekly Newsletter.