• Skip to primary navigation
  • Skip to main content
  • Skip to primary sidebar
  • Skip to footer

TronWeekly

Crypto World News

  • Home
  • Education
    • Best TRON Wallets
    • Beginner’s guide to TRON
  • Opinion
    • Tron Tokens
    • Market Analysis
  • Industry
    • Tron Exchange
    • Project Review
  • Press Release
  • Advertise
  • About us
    • The Team
    • Editorial Policy
    • Write for us
    • Privacy Policy
    • Disclaimer
    • Terms and Conditions
    • Contact
You are here: Home / Archives for Analysis

Analysis

XRP fights back against the bear as altcoin prices take a hit

July 30, 2021 by Akash Anand

XRP and its counterparts in the cryptocurrency market have gone through a tumultuous time which included price fluctuations and changes in market cap. Although major players like Bitcoin hit a bearish stop, XRP continued its surge to climb to the 6th position on the charts. Bitcoin at the same time was falling by approximately 5 percent in the hourly spectrum. 

At press time, XRP was trading for $0.72 with a total market cap of $33.54 billion. The cryptocurrency’s 23.5 percent weekly growth elevated its daily trading volume to $3.55 billion. Many analysts expect XRP to slow down soon to settle into a stagnant price movement. 
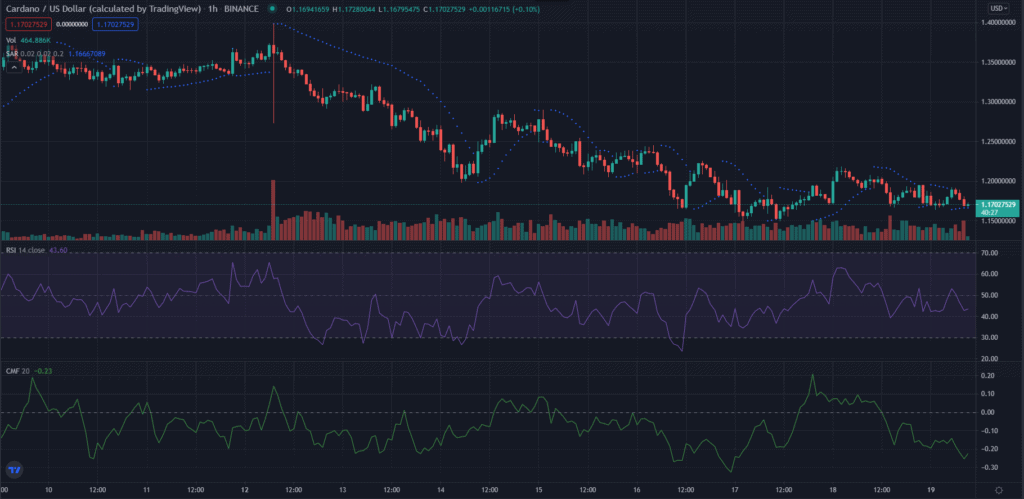
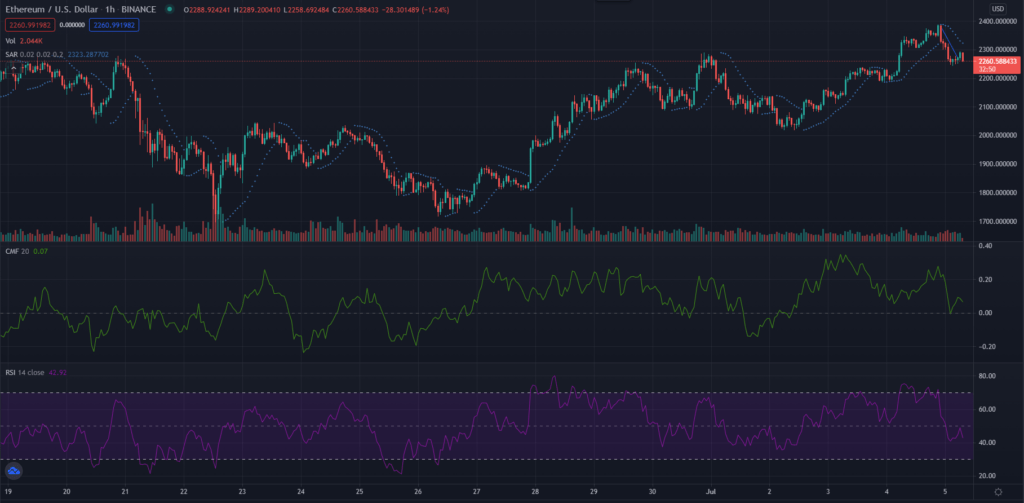
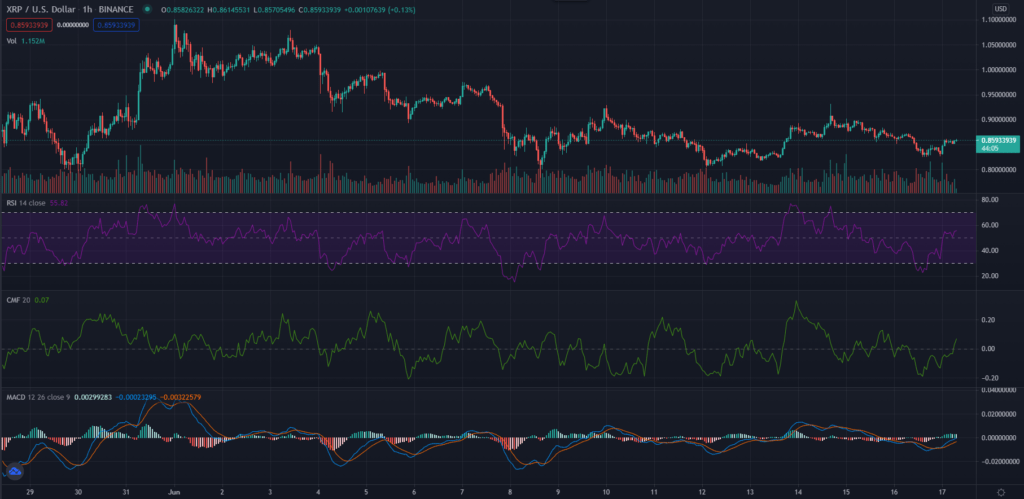
XRP 1 hour:

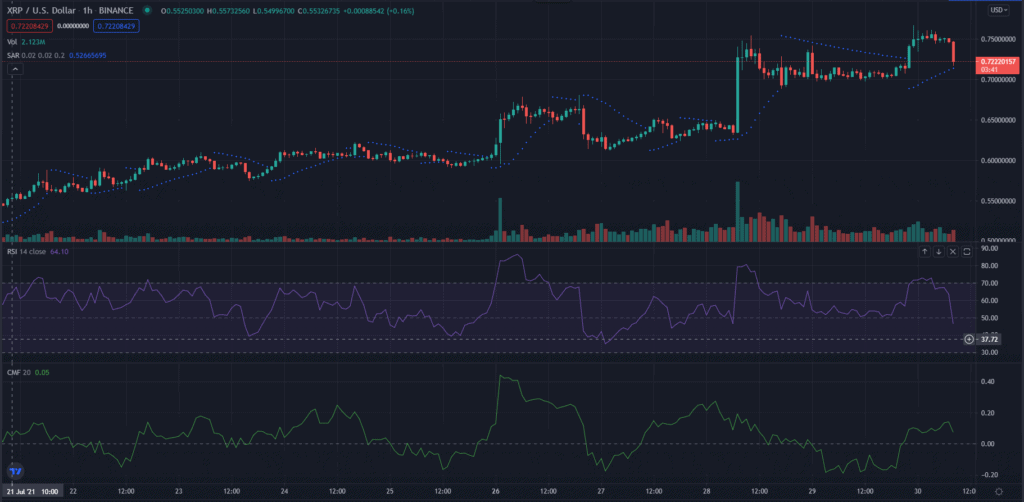
Price variations across the board played a pivotal role in boosting XRP’s credentials on the charts. The latest immediate support was raised to $0.69 after a change in buying sentiment. 

XRP’s RSI leaned towards the bearish spectrum as the selling pressure overtook the market.

Short-term CMF performed better than the RSI with the graph staying above the zero lines. 

Only the PSAR sided with the bull. The markers continuously stayed below the candles as the buying momentum increased. 
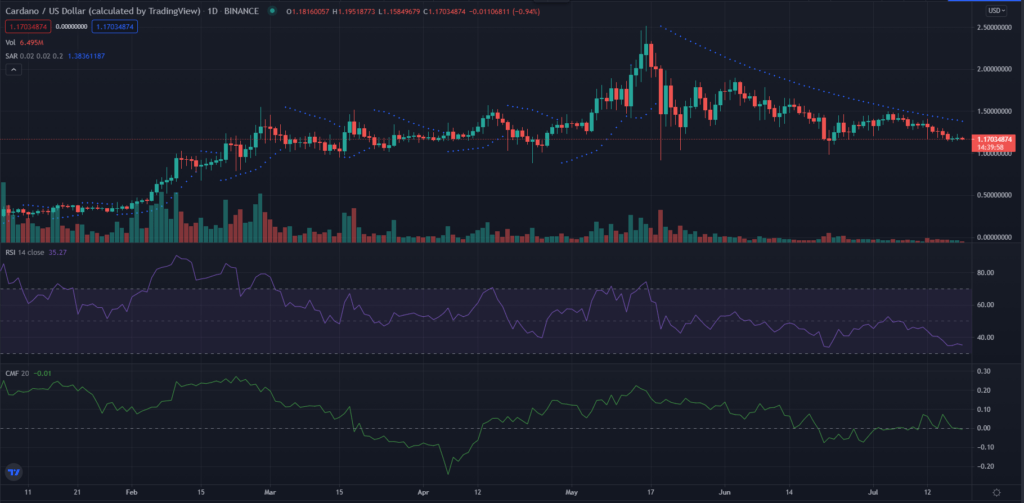
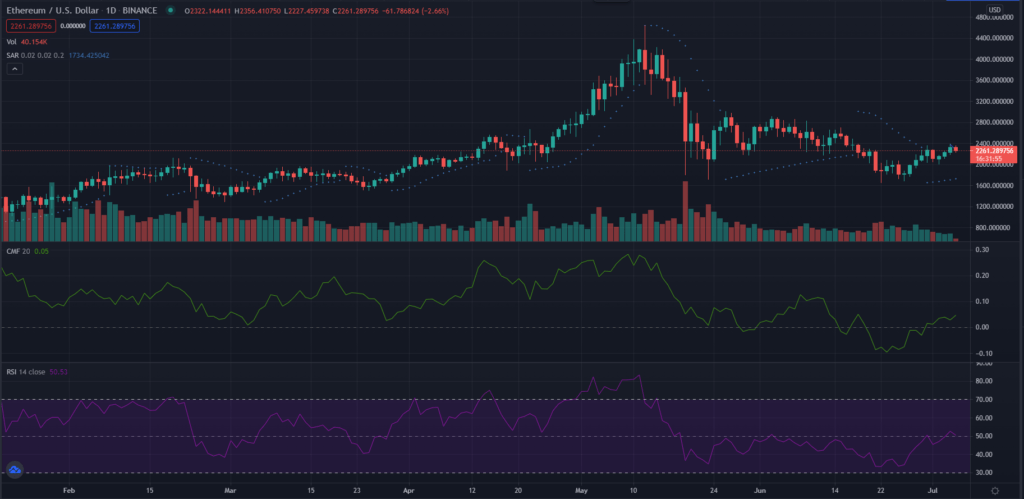
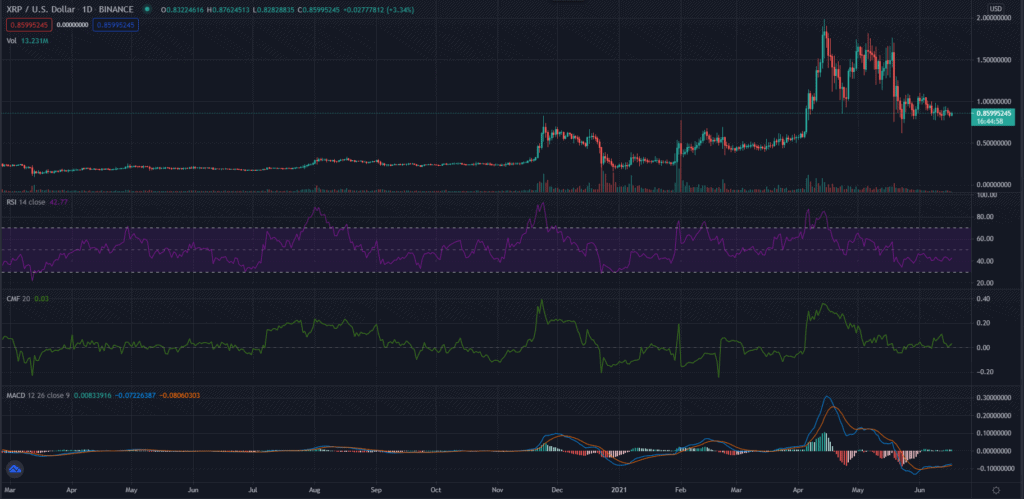
XRP 1 day:

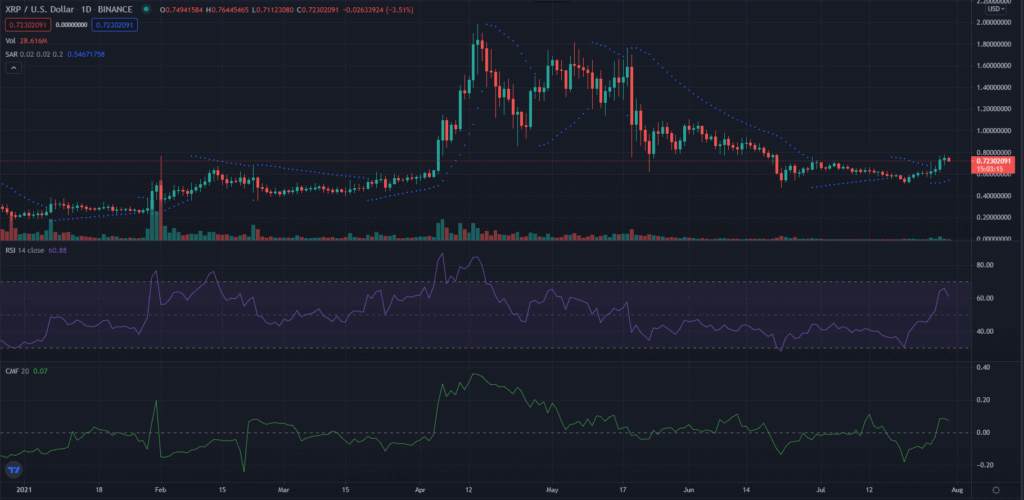
In the long term, XRP had fallen into a stagnant price movement. A lack of resistance breaks forced the cryptocurrency into a lull with immediate support at 0.55. 

Long-term PSAR mimicked the hourly charts as the markers pushed the candles up. 

The RSI and CMF were both bullish on the daily chart. According to the RSI, more users held XRP thereby increasing the overall selling pressure. The RSI showed that the capital coming into the XRP market was more than the capital leaving the market. 

Filed Under: Altcoin News, Market Analysis Tagged With: Analysis, price, xrp

Cardano [ADA] Bleeds Red as Altcoins Face-Off With Bear

July 19, 2021 by Akash Anand

The cryptocurrency market’s slowdown over the past few days has resulted in millions being wiped off in terms of market caps and trading volumes. Bitcoin’s lack of movement may be a reason why other coins are taking a turn in the bear pit. Cardano [ADA] was one of the altcoins in the tumble, falling in double-digit numbers over the past week.

IOHK’s cryptocurrency, hailed as a successor to trading currencies, fell across the board after a stagnant price hold. At press time, ADA was trading for $1.17 with a total market cap of $37.52 billion. The 5th placed cryptocurrency was well ahead of its nearest competitor XRP in terms of trading volume and market cap.

Cardano 1 hour:

Cardano’s hourly performance took quite the tumble as the cryptocurrency fell from highs as much as $1.302. The current immediate support was calculated to be $1.152 after which the price bounced to its current value of $1.171.

According to the Parabolic SAR, ADA was coming out of its bearish slump as the markers stayed below the price candles. Continued buying pressure will be indicated by a prolonged bottom hold by the markers.

The cryptocurrency’s RSI indicator sharply fell below the zero line as more users sold their ADA holdings. Since the start of the month, Cardano has found it difficult to maintain its RSI graph above the zero line for long periods of time. Cardano’s CMF crashed to one of its lowest points of the month with chances for a small revival in the near future.

Cardano 1 day:

Daily performance was slightly different from earlier as Cardano found it difficult to escape the bearish rut. Cardano’s long-term resistance was at $1.17 with the Parabolic SAR markers holding above the price candles since the middle of May.

Cardano’s long-term RSI moved parallel to the oversold zone while hitting one of the lowest levels this year. The CMF skirted on the zero line as the capital influx and the capital leaving the market canceled each other out. Experts believe that continued developments would restore the faith in investors and in turn generate traction for the cryptocurrency.

Filed Under: Altcoin News, Market Analysis Tagged With: ADA, Analysis, Cardano, price

Dogecoin tries to fend off bear as price recovery takes a hit

July 12, 2021 by Akash Anand

The new week has seen the cryptocurrency market obtain a greenish tinge after a dip last week. Major cryptocurrency pumped on Monday allowing some coins such as DOGE to climb out of their bear trap. Dogecoin had plummeted on weekly timeframes with the last recorded 7-day fall being 10.7 percent. Although there was a slight fall in market cap, investor sentiment allowed Dogecoin to stay in 7th place.

At press time, DOGE was trading for $0.22 with a market cap of $28.2 billion. The weekly 10.82 price percent drop brought the DOGE trading volume down to $765.412 million. Its rapid climb over the previous weeks has allowed DOGE to be within striking distance of XRP’s market cap. An increased buying pressure would be the ideal boost that DOGE needs to get out of its bearish predicament.

Dogecoin 1 hour:

Readings from Binance showed that Dogecoin’s value had been gradually decreasing since the start of July. After a reverse breakout on the 9th, the cryptocurrency has held a steady price action for the following 48 hours. The immediate support clocked in at $0.19 while the resistance held at $0.256.

According to the RSI, Dogecoin was heading towards some more bear troubles. A sharp dip towards the oversold zone suggested that users were selling their tokens in exchange for less volatile assets. DOGE’s CMF also sided with the bear as the graph fell below the zero line. This came after the cryptocurrency’s struggle to stay in the green zone, something which it has struggled to do this month.

The Parabolic SAR on the hourly chart pointed toward’s DOGE struggle to stay bullish. Markers were below the price candles and could mean a potential bull patch for DOGE soon.

Dogecoin 1 day:

After picking up in April, DOGE has never looked back to go to its previous levels. Peaking in the middle of May, the cryptocurrency has since fallen to more controlled levels. The earlier hype had even lifted Dogecoin’s value to $0.7 after the hype created by Elon Musk.

The Chaikin Money Flow indicator in the long term told a tale of a cryptocurrency struggling to obtain capital infusion. Investors seem to have lost interest in stocking up DOGE like they did back in April and May. Dogecoin’s RSI moved parallel to the midline in the oversold zone. The last time the graph had climbed above the midline was at the beginning of June.

Long-term PSAR markers stayed below the price candles as Dogecoin continued its sustained hold near the $0.2 mark.

Filed Under: News, Altcoin News, Market Analysis Tagged With: Analysis, Dogecoin, price

Ethereum Rides The Bull As Market Shows Signs Of Recovery

July 5, 2021 by Akash Anand

Ethereum’s rise and fall on the charts were also mimicked by other top honchos of the crypto world at July open. Although ETH’s price action evidently sided with the bear, long-term performances continued to blink green. It was also the biggest gainer in the top 10 club over the previous 7 days.

Ethereum’s market was majorly captured by Binance which controlled $1.345 billion of running circulation. Huobi, which came in second, only controlled $613 million of all Ethereum available. Ethereum also made news recently when its active addresses surpassed that of Bitcoin. On-chain analysis organization Santiment had tweeted:

“On a day that saw history be made with #Ethereum surpassing #Bitcoin in daily active addresses for the first time, #altcoins came to play. $KSM, $COMP, and $ZIL were among many projects to make an imprint on the markets, while $BTC ranged around $34.5k.”

Ethereum 1 hour:

The PSAR’s hold above the price candles was enough to show the bear’s impact on the ETH market. If the pressure mounts, then the price can fall further. At the same time, the Relative Strength Index sharply fell towards the zero line after bouncing from it. The dip was a sign that the capital leaving the market had surpassed the influx.

Even Ethereum’s RSI showed no reprieve as the graph headed towards the oversold zone. Once more users buy into the market, one can see the graph climb into the overbought zone again.

Ethereum 1 day:

The long-term chart was much more bullish than the hourly timeframe. The PSAR and the CMF were bullish with sharp inclines. The PSAR’s settlement below the candles was enough to boost user trust.

On its own, the CMF had climbed above the zero line with a sharp incline. The newly invigorated market was seen as the ideal candidate to lay the building blocks for Ethereum’s future. The RSI settled on the line as the selling pressure and buying pressure equalized on Monday.

Filed Under: News, Altcoin News, Market Analysis Tagged With: Analysis, ETH

Ethereum Classic [ETC] Dips Significantly After a Roaring June Final Week

July 1, 2021 by Akash Anand

July started with a mix of bullish and bearish signals for the cryptocurrency market. While cryptos like Bitcoin and XRP felt the bear crunch, altcoins such as Ethereum Classic were on the rise. The Ethereum fork was the biggest gainer in the top 20 club as it surpassed major players like XRP, and Dogecoin.

Ethereum Classic held the 19th rank on the charts, just falling short of THETA’s market cap. At press time, ETC was trading for $53.6 with a total cap of $6.145 billion. A 28 percent growth over the previous week had elevated the daily trading volume to $4.752 billion. Ethereum Classic also displayed another characteristic: it was the biggest weekly gainer and the biggest daily loser in the top 20 clubs simultaneously.

The cryptocurrency recorded a 10 percent dip in the last 24 hours which was 3x higher than BTC. ETC also has the advantage of a strong RSI which stayed above the $50 mark. The cryptocurrency’s 30-day moving average resed at $53.398 while investors hope for a bullish turnaround soon.

ETC 1 hour:

ETC’s hourly performance impacted its positive price action implemented on the 28th. Both the Bollinger bands diverged slightly from one another, which indicated the formation of a bearish price cloud. The RSI had dipped even further to $40 in the last 24-hours.

The Chaikin Money Flow was struggling to break out from underneath the price candles. This was an indication of the capital loss between the funds coming into the market and the funds leaving it.

ETC 1 day:

On the long-term charts, ETC was an example of steady movement. Since mid-May, the price action has been almost stagnant with the exception of slight bearish drops. The RSI here was nearer to the overbought zone after an increase in the number of ETC holders.

The Chaikin Money Flow indicator also sided with the bull as the graph ascended above the zero line. The sharp turn in the CMF can be attributed to users flooding the ETC market. Ethereum Classic’s Bollinger bands moved parallel to each other after its sustained price hold. It is predicted that the cloud may not be as large as the hourly charts because of the pattern break.

Filed Under: News, Market Analysis Tagged With: Analysis, Ethereum Classic

Cardano [ADA] reemerges from shallows as the crypto market tries to keep bear at bay

June 23, 2021 by Akash Anand

The cryptocurrency market’s bleed over the past few days caused several alarm bells to go off as investors struggled to cope with the price crunch. Billions in the market cap were slashed in the last 48 hours as Bitcoin triggered the fall for the rest of its compatriots.

Altcoins such as Ethereum, XRP, and Cardano all had their 2021 gains removed during the bear crunch after which the prices stabilized. At press time, Cardano was trading for $1.26 with a total market cap of $4-.145 billion. The 20 percent drop in weekly movement brought down the daily trading volume to $6.41 billion.

Despite the crunch, many coins have recovered on the charts today. Over the last 24-hours, Cardano climbed by over 13 percent, a performance far superior than most of its peers in the top 10 crypto club.

Cardano 1 hour:

Cardano holders heaved a sigh of relief over the previous 24 hours as the cryptocurrency settled back to its earlier price groove. As ADA settled at $1.25, the immediate support had been lowered to $1.008. The current resistance in the short term clocked in at $1.45.

The upper and lower Bollinger bands converged towards the candles, a sign of an imminent price breakout. The size of the Bollinger cloud signified the range of fluctuations that had occurred over the previous 48 hours. According to the Relative Strength Index, Cardano was holding strong in the overbought zone after it crashed below the oversold line on June 22.

The Chaikin Money Flow indicator blinked green for ADA as the graph climbed in a linear fashion. This meant that the capital influx into the Cardano market was more than the capital leaving the market.

Cardano 1 day:

The daily charts painted the picture of a cryptocurrency stabilizing after a tumultuous start to the week. Cardano’s long term support at $0.81 was untouched in the recent bear run as the price took a turn for the better.

Cardano’s daily Bollinger bands diverged from each other after its pipeline hold on the charts during the price stabilization. The parallel movement by the bands corelated to the lack of major price movements at the start of the month.

Long term RSI indicated a bullish run after the formation of a u-turn on the chart. Analysts stated that the change may be due to more investors flooding the market. The CMF, on the other hand, sharply fell towards the bottom of the zero line.

Proponents of the market have reassured investors that bear runs where natural and that it is a prevlanet phenomenon across all mainstream trading ecosystems. Despite the losses, one phrase echoes strongly in the cryptocurrency space: “buy the dip”.

Filed Under: Market Analysis, Altcoin News Tagged With: ADA, Analysis, Cardano, Cryptocurrency, price

XRP [XRP/USD] Price Analysis: Cryptocurrency remains buoyed by strong support and resistance

June 17, 2021 by Akash Anand

The cryptocurrency market’s relationship with the bull has been a tumultuous one of late with price fluctuations taking over. Although the price dips were not very significant, Bitcoin and a majority of the altcoins such as XRP and Ethereum mimicked the same bearish signals. At the time of writing, XRP ranked 7th on the charts with a market cap that was a billion dollars short of its nearest competitor, Dogecoin.

Clocking in at $0.852, XRP had undergone a minor 2.05 percent price reduction over the past week. XRP’s price changes have also been a result of the Ripple lawsuit and its resulting events. Back in 2020, the United States Securities and Exchanges Commission [SEC] had asked XRP’s parent to divulge details regarding its workings. Despite the pushback, XRP surged over the past couple of months to hit new all-time highs.

XRP 1 hour:

XRP’s short terms gains gave hope to investors that a bear run was impending. The candles turned green right before the immediate support which stood at $0.83. Its immediate resistance was $0.9, far crypto from its earlier all-time highs. All the indicators are taken in the technical analysis point to greener pastures for the seventh-largest cryptocurrency on the charts.

The Relative Strength Index had climbed over the zero line which meant that more people were buying XRP rather than selling it. Next in line was the Chaikin Money Flow indicator which projected a liner growth on the graph. This was in line with more investor money coming into the XRP ecosystem over the past couple of months. The MACD indicators in the short term had diverged towards the top as the histogram blinked green.

XRP 1 day:

The long-term gains enjoyed by XRP have elevated its support and resistance to levels unseen in 2020 or 2019. As it stands, the long-term support and resistance are $0.9 and $1.34 respectively. The aforementioned indicators took a more bearish stance when it came to long-term analysis.

XRP’s daily CMF indicators settled on the zero line with no major fluctuations in terms of capital coming in or leaving the market. The RSI signaled a stronger bearish signal as the indicator was much closer to the overbought zone than the oversold zone. A strong market sentiment allowed XRP to be buoyed between the overbought-oversold territory. The MACD indicator had crossed over at the start of the month, after which it continued a divergent path.

Filed Under: Altcoin News Tagged With: Analysis, Cryptocurrency, price, ripple, xrp

Bitcoin wades through greener pastures as investors move big money

June 15, 2021 by Akash Anand

The past couple of days have written a positive script for the cryptocurrency market as prices began climbing again. Bitcoin and its compatriots enjoyed a surge post last weekend as the world’s largest cryptocurrency surpassed the $40,000, triggering a market-wide bull run.

At the time of writing, Bitcoin was trading for $40,086 at a market cap of $751.8 billion. Over the course of the last 7 days, BTC’s value had jumped by a whopping 22 percent. With a 24-hour trading volume of $46.37 billion, BTC was still miles ahead of its altcoin peer, Ethereum.

Bitcoin daily split

The hourly chart indicated a bullish path for Bitcoin, atleast till the close of the week. Hourly support held at $38,445 while the resistance had charted new territory at $43,289. The trend line on the hourly chart is representative of the market action right now, albeit on a smaller scale.

The MACD lines ha converged at the start of the bull run after which their movement has been largely parallel to one another. Corresponding histogram readings further added to the theory that the bull run was a fluctuating phenomenon. Bitcoin’s RSI indicator had fallen from the edges of the overbought zone and continued a mostly genial path.

This meant more and more people were buying into the Bitcoin market triggering an influx of capital as seen on the Chaikin Money Flow charts. Bitcoin’s short-term CMF stayed above the zero line, a sign that the capital coming into the market was more than the capital leaving it.

Bitcoin’s 24-hour range was slightly different with higher resistances and supports. At press time, the daily support was $32,477 while the resistance still held at Bitcoin’s ATH. The MACD lines on the daily chart were a stark contrast to the hourly charts.

Although Bitcoin needs to sustain its current price hike to make it big in the long term, all the signs were pointing to it. The Relative Strength Index metric recently climbed over the zero threshold towards the overbought zone. This was of significance because it had stayed below it for the past 30 days.

The aforementioned charts paint the picture of a cryptocurrency slowly but surely entering a bullish phase. Bitcoin’s price candles in the short term have seen more green than red for the first time in weeks and that is a definite ace in the sleeve for investors everywhere.

Filed Under: News, Bitcoin News Tagged With: Analysis, Bitcoin (BTC), bull run, price

Bitcoin [BTC/USD] Price Analysis: Cryptocurrency Continues its Sideways Hold as $10k Mark Remains Elusive

June 17, 2020 by Akash Anand

The past few weeks have been a rollercoaster ride for Bitcoin and the cryptocurrency market, as prices have constantly shifted between bearish and bullish states. Investors have now begun looking at different opportunities to establish the Bitcoin ecosystem, and the price action seems to reflect the same.

Bitcoin’s price action over the past week has been on the safe side, with immediate support and resistance holding steady. Although the largest cryptocurrency in the world has yet to break the $10,000 mark over a long period of time, supporters were still hopeful.

At press time, Bitcoin was trading for $9497.29 with a total market cap of $174.815 billion. A slight 0.2 percent price fall over the previous 24-hours caused the daily market volume to clock at $20.077 billion. Bitcoin was not the only cryptocurrency stuck in a sideways movement as other altcoins followed suit.

A technical analysis showed that Bitcoin’s immediate support was at $8565 while the immediat3e resistance rose to a healthy $10,189. Some evangelists have predicted that if this pattern continues, Bitcoin would enjoy a decent hike in the coming future.

BTC 1-day TA:

The Parabolic SAR for Bitcoin showed a price hike that was recently overturned by the bear. At the moment, the markers were above the price candles which meant that the cryptocurrency would be going through a bearish atmosphere soon.

Bitcoin’s Relative Strength Index displayed the story of sideways price movement very cleary. The RSI had earlier held near the overbought zone but the last week has seen the graph holding near the middle of the graph. This could indicate the buying pressure and selling pressure within the Bitcoin ecosystem had neutralized each other.

The Chaikin Money Flow indicator for Bitcoin showed positive signs of recovery. The graph had climbed since the start of June and has reached one of the highest points since the start of March. Bitcoin’s hold above the zero line was an indication that the capital coming into the market was more than the capital that was leaving the market.

Filed Under: Bitcoin News Tagged With: Analysis, Bitcoin (BTC), news, price

YouTube takes Tone Vays Off its Platform as Analyst Asks for Proper Explanation

April 16, 2020 by Ketaki Dixit

The cryptocurrency industry has seen backlash from various sectors of society, ranging from the financial world to the sentiments held by people. YouTube was the latest platform to come cracking down on the industry, a move that was halted by critics.

Despite YouTube promising not to tamper with content related to crypto, the video streaming channel has gone ahead and done exactly that with Tone Vays’ account. On April 16, the digital asset analyst informed users on Twitter that his account was suspended right after a warning.

Vays became popular for his trading calls on cryptocurrencies and Bitcoin price predictions. The former Bear Stearns and JP Morgan Chase employee claimed that YouTube did not give him any prior intimation that his account would be taken down. The video streaming platform had sent him just a warning which Vays appealed almost immediately.

The analyst was evidently angry at YouTube’s decision and admitted that he may have to consider a “career change” if his account was not restored. One of Vays’ latest tweets read:

“So that escalated quickly. From a single video warning to the ENTIRE CHANNEL Being taken down by YouTube. If @TeamYouTube can’t resolve this, might be a career change in the near future. Will just trade during the day and have a nutrition @ytcreators channels at night.”

YouTube’s latest move comes after the company assured the cryptocurrency community that it would not remove videos pertaining to the field as per a decision made in December 2019. All the videos that were taken down in that period was eventually restored with a YouTube spokesperson admitting that the company made a mistake.

Vays revealed in public that he was logged out of his YouTube mobile application, banning him from watching any form of content. YouTube seems to have even removed Vays’ curated playlists from other creators in the space. The cryptocurrency analyst is currently waiting for a reply from YouTube after he appealed the takedown.

Filed Under: Bitcoin News Tagged With: Analysis, Bitcoin (BTC)

  • Go to page 1
  • Go to page 2
  • Go to Next Page »

Primary Sidebar

Recent Posts

  • Mixin Network’s Bid $20M Bug Bounty For Hacker Behind $200M Breach September 28, 2023
  • Ethereum’s OFAC Compliance: A Dramatic Drop In Censorship Post-Merge Upgrade September 28, 2023
  • Ethereum’s Technical Analysis Suggests a 12% Rally Could Materialize September 28, 2023
  • Kraken Secures European Foothold: EMI License In Ireland & VASP Registration In Spain September 28, 2023
  • Shiba Inu’s BONE Token Edges Towards $1 in its Pursuit of Full Decentralization September 28, 2023

Footer

News

  • Altcoin News
  • Bitcoin News
  • Blockchain
  • Tron News
  • World

Digest

  • Meet the Founder
  • Price Winning Article
  • DeFi
  • Cyber Security
  • Crypto Scam

Industry

  • Project Review
  • Technology
  • Fintech
  • Tron Exchange
  • New in Town

Tron Universe

  • Event and Tron Parties
  • New in Town
  • Tron Tokens

Follow Us

Subscribe US

Copyright © 2023 · Tron Weekly. All Rights Reserved. NOTE: Tron Weekly is an independent crypto news site that adheres to the strict journalism policy anchored on transparency, trust, and objectivity, we have no affiliation with the TRON Foundation, its founder Justin Sun or any other cryptocurrency firm.