
- Theta is at the resistance level and might clear the long-term bearish trend soon.
- Theta might experience a bull run because technical indicators, such as MACD or moving averages are showing positive signs.
- According to analysts, when Theta breaks out with confidence, then it would be expected to close towards goals as high as $2.10.
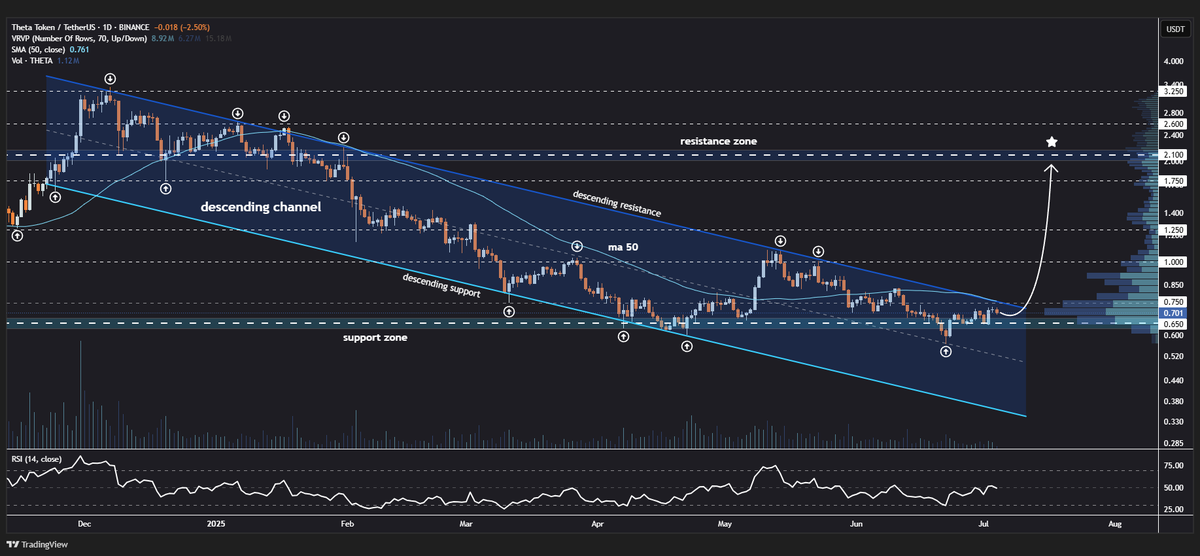
Crypto analyst Jonathan Carter has said that the cryptocurrency Theta is likely to move out of a long-range decline. He elaborated that Theta is nearing the top of the falling price channel on daily charts.
Once this area is overcome, especially when bolstered by the 50-day moving average, a powerful rally would begin. Should this happen, Theta may soar gradually with expected values of $1.00, $1.25, $1.75 and even up to $2.10.
Theta Traders Eye Key Breakout at Resistance Level
Regarding Theta’s market position, Carter emphasized that the clarity should come first before leaping. According to the chart, Theta has been trading within the major areas of resistance and support over the last 3 or 4 months. It has also come back to the testing of the descending resistance line several times, only to fail in making a breakout.
Source: X
Also Read | Crypto Token Unlocks July Schedule: Over $3 Billion Set to Hit the Market
But as the price is once again near the resistance zone, the traders are keen on an upward surge. A breakout would imply that the trend is at last changing, and thus there is an opportunity to make profits.
There are also some volume profiles hinting at increasing interest near to the price touching the key breakout area. In the meantime, the 50-day moving average lies close to the present price, which serves as a potential launching pad toward the next rise.
Once the price is seen to close decisively above the channel and above the moving average, then it is possible that the bullish momentum will increase. Carter has identified a few price points that the token may hit sequentially as the rally happens.
MACD Nears Crossover as Theta Shows Early Signs of Momentum
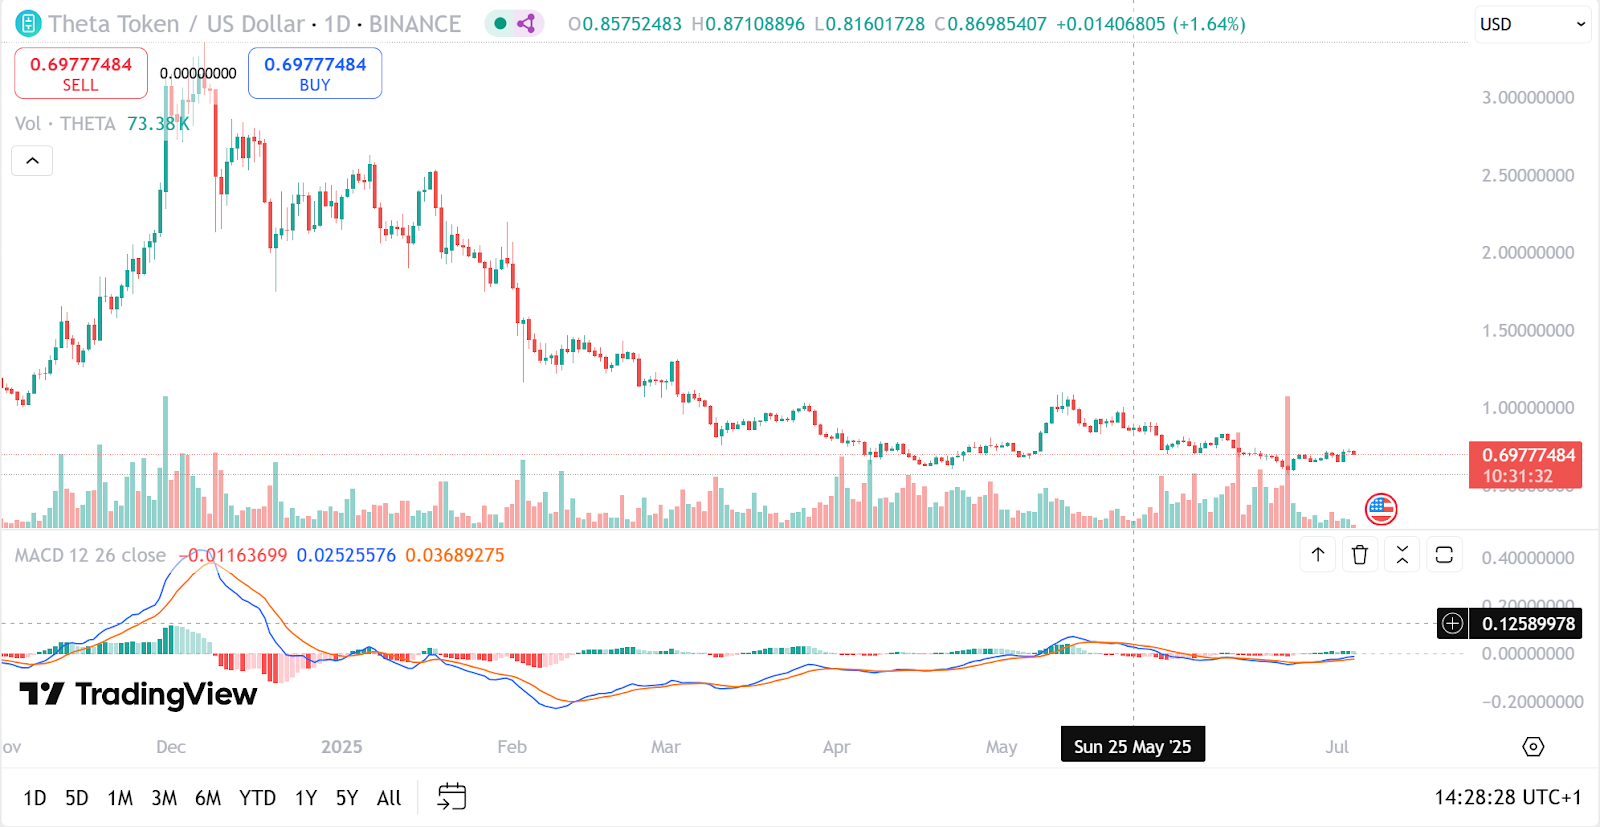
To support Carter’s view, another chart by TradingView reveals that there have been minor increases in value as of late. Daily candles indicate more stability after months of decreases, which is an indication of the trend weakening.
Source: TradingView
The MACD indicator currently has the MACD line near zero with decreased selling pressure and a prospective upside crossover. This is a sign that bullish momentum is increasing.
The volumes are not big, yet the latest candles indicate the amplification of the purchasing activity. What analysts are seeking is a above-resistance candle with good volumes.
In case this occurs, then this may be the beginning of a good counterturn, and the goals that were common with Carter may turn into feasible ones with time. Traders should be alert yet ready until that period.
Also Read | XRP Price Primed for Breakout as Bullish Pattern Targets $2.65