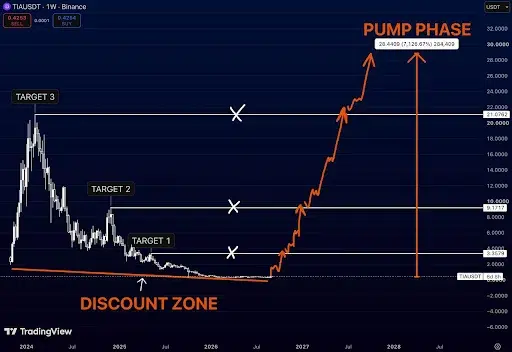
Celestia’s TIA token is showing signs of a potential long-term reversal after nearly two years of sustained weakness. Crypto analyst etherealist highlighted the setup, noting that TIA has been trading deep inside a discount zone around $0.42. The prolonged decline could create an asymmetric setup if buyers successfully establish a durable long-term base.
Table of Contents
The analyst identified $3.35, $9.17, and $21.07 as major upside checkpoints. A breakout from the current long-term base could make these levels potential stages of the next expansion.
The broader scenario on the chart reaches approximately $28-$29, representing a potential gain of more than 7,000% from the highlighted bottom.
Source: etherealist’s X Post
However, the projected move remains a technical scenario rather than a guaranteed outcome. TIA must first regain momentum and overcome several resistance areas before such an expansion can develop.
TIA Price Consolidates Above Key Support
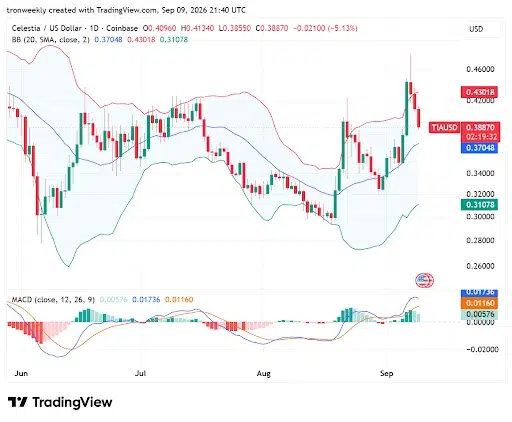
TIA gives a better insight into the token’s construction. Based on the TradingView analysis, the current price of TIA is $0.38870, which is 5.13% lower than its recent high of $0.4600. Due to the decline, the price has approached the mid-Bollinger Band, which is $0.37048.
This zone is now a significant support area dynamically due to the sudden breakout witnessed at the beginning of September. A failure below $0.37048 might make it possible for TIA to consolidate and push the price towards the $0.46 level.
Source: TradingView
Conversely, a breakdown below this support will put pressure on the technical structure over the short term. This might result in the exposure of the lower Bollinger Band at $0.31078.
Also Read: Can Celestia (TIA) Rally 28% After This Crucial Technical Breakout?
MACD Shows Bullish Momentum Is Cooling
The momentum indicators have given a mixed view about the TIA price performance ahead. In the daily timeframe, the MACD has a mainline reading of 0.01736, which is higher than the signal line of 0.01160. This gives an overall positive momentum setup for the bulls.
On the other hand, the MACD histogram has relaxed to 0.00576, meaning that the bullish momentum is weakening. However, this does not necessarily mean that the corrective pattern fails, but it means that TIA must consolidate above support for the bullish structure to continue.
With the support at $0.37048 intact, the bulls may test previous highs again. A break below it would direct the market focus on $0.31.
Derivatives Activity Signals Caution Ahead
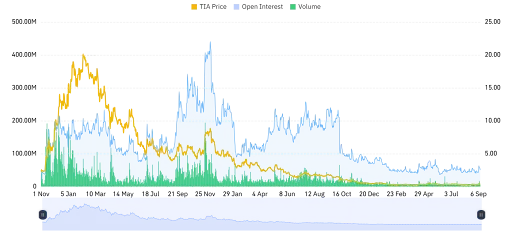
According to Coinglass statistics, trading of TIA derivatives has decreased due to lower exposure. The trading volume has fallen by 17.73% to $82.67 million, while open interest dropped by 7.70% to $52.68 million.
Source: Coinglass
Both decreases in trading volume and open interest can indicate a decrease in participation and leverage. It means that traders are looking for more confirmation before making their next move.
The increase in trading volume and open interest in addition to the breakout is confirmation for bulls. Otherwise, the current situation will lead TIA to the consolidation phase.
Celestia’s Data Layer Faces Supply Pressure
Apart from technical metrics, an analyst named Akshy emphasized the contribution of Celestia in developing the data layer for modular blockchain networks. The Data Availability Sampling by Celestia enables light clients to check block data publication without needing to download the whole block.
That technology gives Celestia a fundamental growth narrative as blockchain networks demand more efficient data availability solutions. However, continued TIA token supply releases in September could add selling pressure.
This creates an important test for the broader thesis. Celestia’s network adoption must continue strengthening enough to offset additional supply entering the market.
For now, TIA remains at a critical technical juncture. Holding $0.37048 could preserve the recovery structure, while a decisive breakout could reopen the path toward $3.35 and the higher long-term levels identified by analysts.
Also Read: Celestia Eyes Bullish Reversal Toward $21 as TIA Price Holds Key Support
This article contains market analysis and price predictions. These are not guarantees. Crypto markets are volatile. Always DYOR. Not financial advice.