- TRON is trading at $0.2729 with over $579.93 million in 24-hour trading volume.
- Price action remains stable despite mild weekly gains of around 1%.
- Technical indicators show consolidation and signal a potential breakout formation.
- Resistance sits near $0.285, while support holds around $0.270, framing a narrow trading channel.
TRON (TRX) continues to trade steadily in a narrow price range despite displaying signs of brief volatility. At the time of writing, the token is priced at $0.2729 with a market capitalization of $25.88 billion.
While the 24-hour chart reflects price stability, TRON has gained nearly 1% over the past week, hinting at a possible bullish shift. Trading volume remains robust at $579.93 million, showing continued interest from market participants despite the lack of significant movement in the daily timeframe.
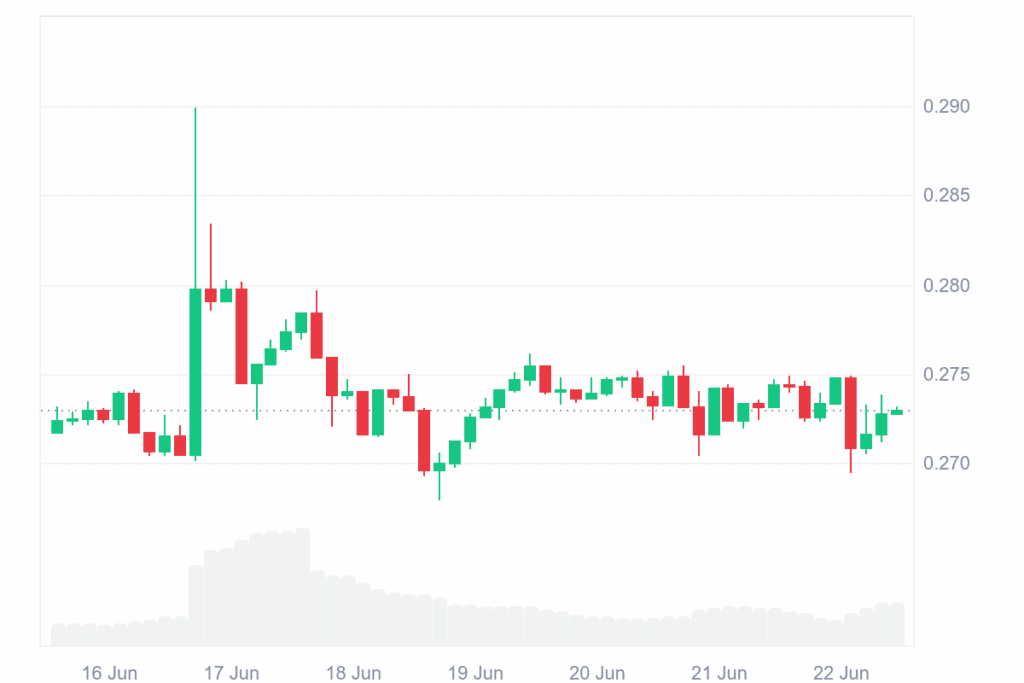
Price action on the weekly chart reflects a surge followed by a decline and a prolonged period of consolidation. The token’s attempt to climb closer to $0.290 was met with resistance and selling pressure, pushing the price back toward $0.272.
Since then, TRX has been range-bound, trading between support at $0.270 and resistance at $0.285, with low volume and reduced volatility. This consolidation indicates indecision among traders, who are awaiting stronger signals before entering new positions.
TRON Indicators Suggest Imminent Breakout Price Action
On the 4-hour TRX chart, technical patterns support the current consolidation scenario. The price is hovering around $0.27296, closely aligned with the 20-period Simple Moving Average (SMA) of the Bollinger Bands at $0.27362.
The narrowing width of the Bollinger Bands suggests reduced volatility, often preceding a breakout. Resistance appears near the upper band at $0.27589, and support sits at the lower band around $0.27136.
Momentum indicators also align with this neutral structure. The Relative Strength Index (RSI) stands at 48.66, reflecting the market’s balanced nature with no clear buying or selling dominance.

Socure: TradingView
Meanwhile, the MACD remains weak, with nearly flat histogram bars and slight separation between the MACD and signal lines. These conditions suggest that any breakout, either upward or downward, could shift sentiment quickly.
TRX price structure analysts expect an upside breakout potential if the token clears decisively above the level of $0.276. In case bullish momentum gathers more momentum, the following obvious target price ranges between $0.285 and $0.290, retracing previous old highs during the last spike.
On the bearish part, if it cannot maintain above the level of $0.270, we may experience a test of lower support regions around $0.265. In the short term, the market maintains a steady course with traders observing keenly for potential breakout signs.
Related Reading | Tron Explodes 108% in Activity as Massive Bullish Momentum Builds Fast