• Skip to primary navigation
  • Skip to main content
  • Skip to primary sidebar
  • Skip to footer
  • About us
  • Write for us
  • Terms and Conditions
  • Privacy Policy
  • Disclaimer
  • Contact
  • All Posts
  • Advertise

TronWeekly

Crypto World News

  • Home
  • Education
    • Best TRON Wallets
    • Beginner’s guide to TRON
  • Opinion
    • Tron Tokens
    • Market Analysis
  • Industry
    • Tron Exchange
    • Project Review
  • Press Release
  • Advertise
  • About us
    • The Team
    • Editorial Policy
    • Write for us
    • Privacy Policy
    • Disclaimer
    • Terms and Conditions
    • Contact
You are here: Home / News / Tron [TRX/USD] Technical Analysis: Cryptocurrency struggles to maintain price hold during ‘cryptowinter’
price analysi new

Tron [TRX/USD] Technical Analysis: Cryptocurrency struggles to maintain price hold during ‘cryptowinter’

November 12, 2018 by Akash Anand

The cryptocurrency market has been seeing quite the rollercoaster over the past few days with several coins seeing uptrends and downtrends. Popular cryptocurrencies like Bitcoin [BTC], Ethereum [ETH] and Tron [TRX] has been trying hard to maintain its foothold in the market in its march towards mainstream adoption.

1 hour:

trx 1 hour

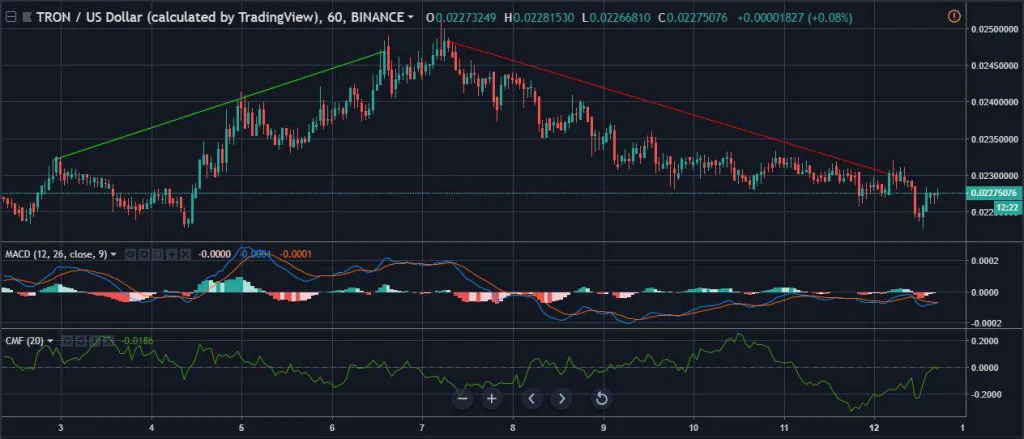
In the one-hour graph the initial uptrend is evident which took the Tron price from $0.0232 to $0.027.The succeeding downtrend bought the prices down from $0.0248 to $0.02302. Tron’s support has been holding at $0.0223 while the resistance is $0.0248.

The MACD indicator points to a crossover between the signal line and the MACD line, with the MACD line pointing downwards. The MACD histogram has almost flattened after the market failed to pick up.

The Chaikin Money Flow indicator has just fallen below the axis after hanging above the line for quite some time. This is an indication of the money flowing out of the market due to the change in the investor sentiments.

1 day:

trx 1 day 1

The one-day Tron graph points to an acute downtrend which has brought the prices down from a lofty $0.0571 to $0.0249. The one-day resistance for Tron is holding at $0.018.

The Awesome Oscillator [AO] has witnessed a due die to the lack of market movement in the cryptoverse. The market momentum has been much lesser than what it was over the last few months.

The Relative Strength Index [RSI] shows the graph falling towards the oversold zone after holding in the middle, coinciding with the sideways price movement. The current price fall indicates that the selling pressure is more than the buying pressure.

Conclusion:

The indicators paint the picture of the ‘cryptowinter’ holding strong. The MACD, CMF,AO and the RSI all tell the story of the price moving sideways with sporadic bullish runs,

Filed Under: News, Market Analysis, Opinion, Tron News

Primary Sidebar

Recent Posts

  • New Crypto Policy: Fed Reserve Promotes Level Playing Field For Banks January 29, 2023
  • Ethereum Poised For Growth In 2023: Experts Predict March Upgrade & Q4 Hot Spots January 29, 2023
  • Polygon Network Takes Second Place In Daily Active Users, Surpasses Ethereum January 28, 2023
  • Cryptocurrency Hazards: White House Outlines Plan To Mitigate Risks In New Framework January 28, 2023
  • Cardano Wallets Grow With Over 50k Added Since Jan.1 January 28, 2023

Footer

News

  • Altcoin News
  • Bitcoin News
  • Blockchain
  • Tron News
  • World

Digest

  • Meet the Founder
  • Price Winning Article
  • DeFi
  • Cyber Security
  • Crypto Scam

Industry

  • Project Review
  • Technology
  • Fintech
  • Tron Exchange
  • New in Town

Tron Universe

  • Event and Tron Parties
  • New in Town
  • Tron Tokens

Follow Us

Subscribe US

Copyright © 2023 · Tron Weekly. All Rights Reserved. NOTE: Tron Weekly is an independent crypto news site that adheres to the strict journalism policy anchored on transparency, trust, and objectivity, we have no affiliation with the TRON Foundation, its founder Justin Sun or any other cryptocurrency firm.