
Official Trump (TRUMP) price has seen a strong recovery following its rally, which has grabbed the interest of investors. However, despite the current gains seen in the currency, the asset is still far from reaching its previous record high, highlighting the dangers of basing decisions on short-term price actions.
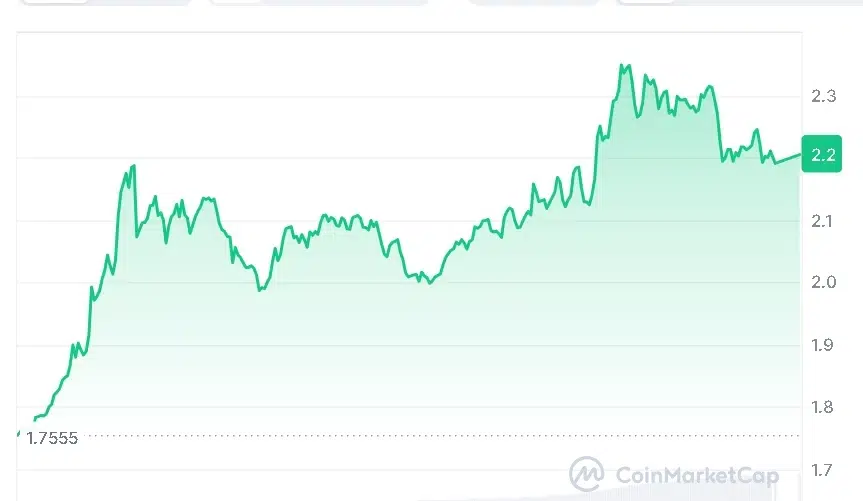
At the time of writing, TRUMP price is trading at $2.20, with a 24-hour trading volume of $1.72 billion and a market capitalization of $518.56 million. The token has gained 24.08% over the last 24 hours, making it one of the best-performing cryptocurrencies in the market.
Also Read | Binance Cancels SpaceX IPO Campaign, Announces SPCXB Airdrop
TRUMP Price Surge Despite Massive Decline
Although this recent uptrend has brought excitement to many investors, there have been warnings from a few market observers. On June 13, 2026, crypto analyst Crypto Patel observed that while everybody is talking about the token’s latest 27% rise, the asset still trades more than 98% below its record highs of January 2025.
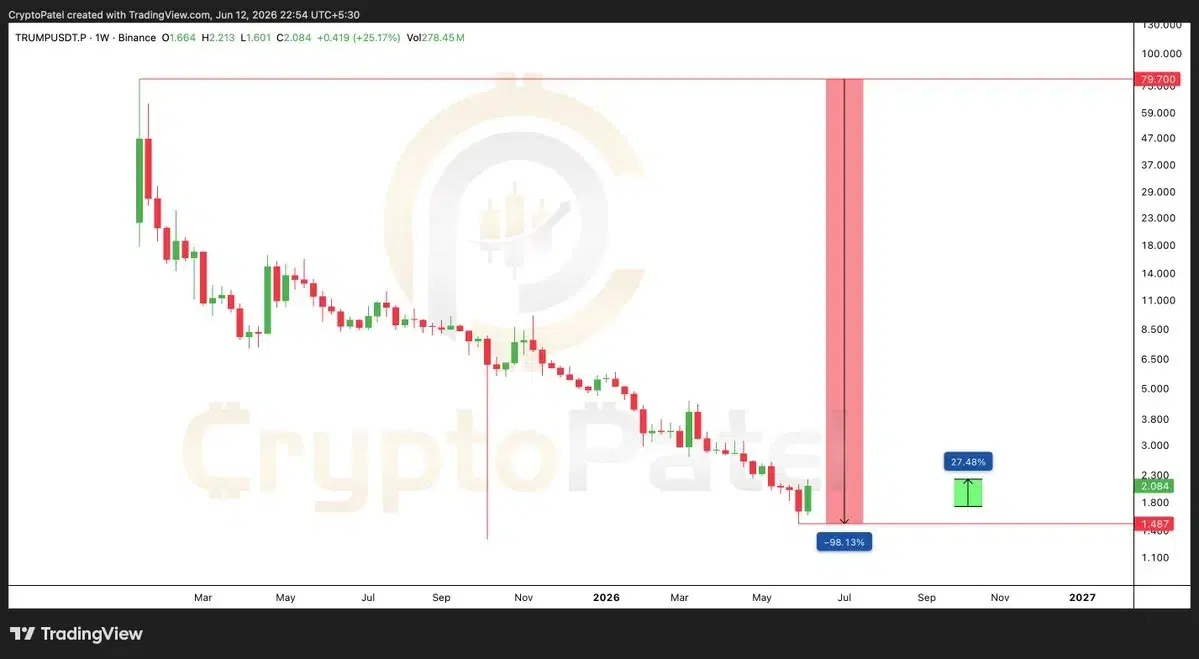
As mentioned by Patel, it is essential to consider that a massive loss will always exceed any small gain that might occur during investment. In the case mentioned above, an investor investing $1,000 in the token when it was at its peak price level would end up holding a value of around $20 now.
TRUMP Price Shows Early Recovery Signs
Technically speaking, TRUMP’s price has been showing some recovery from its prolonged downtrend. Its current level stands at $2.19, which is above the mid-level Bollinger Band of $1.88, suggesting that buyers have taken control.
The Bollinger Bands indicate resistance at $2.25 (top band) while support is seen at $1.50 (bottom band). The current reversal pattern shows potential for continued buying activity. Breaking through $2.25 may increase the bullish trend.
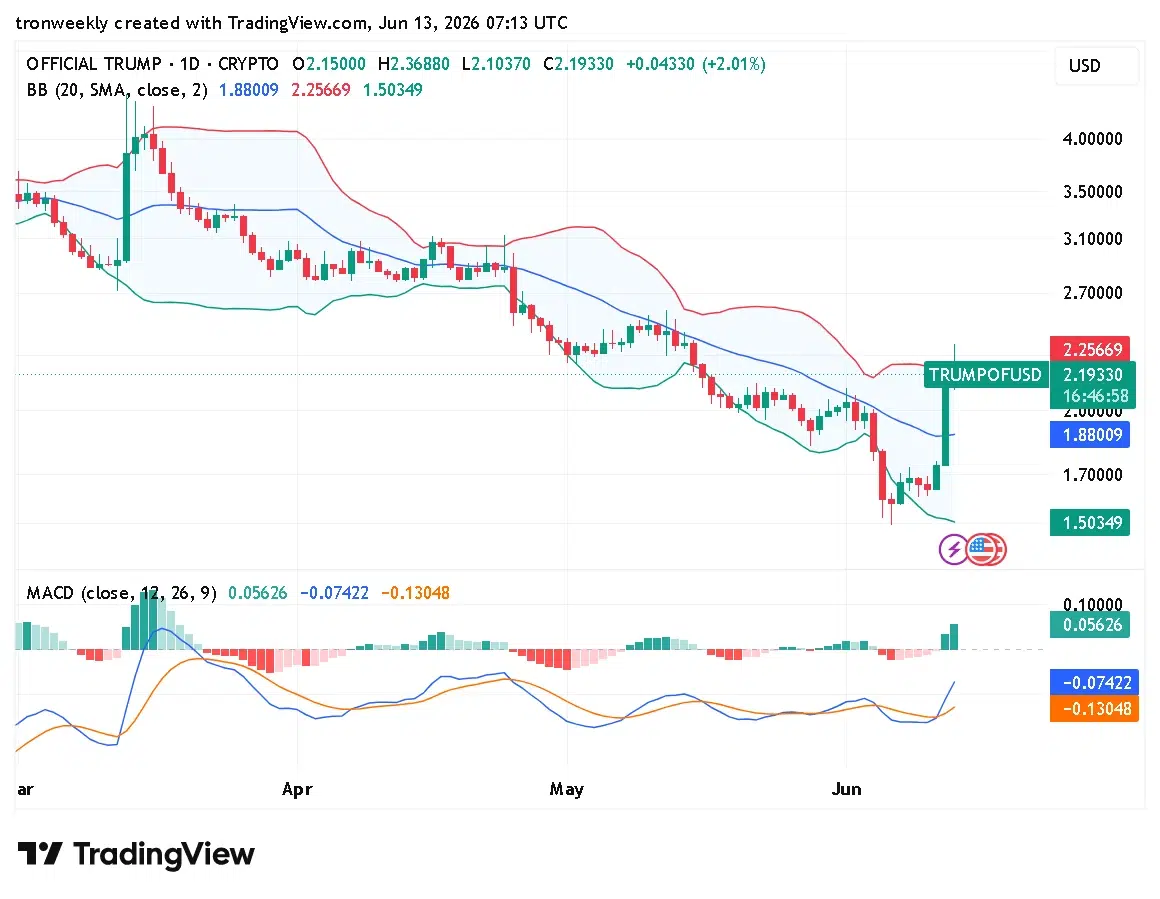
The momentum oscillators have improved. The MACD has made a positive crossover above its signal line. The histogram has become positive, indicating that there is increased buying pressure amid past weakness.
The MACD is showing positive indications as follows: MACD Line is at -0.07422, which is higher than the signal line of -0.13048. The histogram is at 0.05626, indicating rising buying pressure following a period of low buying pressure.
This article contains market analysis and price predictions. These are not guarantees. Crypto markets are volatile. Always DYOR. Not financial advice.
Also Read | US Government Orders Anthropic to Suspend Fable 5 and Mythos 5 Access