Uniswap (UNI) is maintaining a bullish structure as renewed momentum and whale accumulation support market interest. Technical indicators remain constructive despite signs of consolidation, while derivatives positioning continues to strengthen. Traders are watching key support and resistance zones to determine whether UNI can sustain its broader upward trend.
Table of Contents
UNI Price Holds Bullish Structure
Uniswap (UNI) is showing renewed bullish momentum after a sharp recovery from its earlier consolidation range, with traders now watching several important price levels for the next major move.
Crypto analyst LAR highlighted key zones for potential entries, while TradingView indicators, derivatives data, and whale activity point to stronger market interest around UNI.
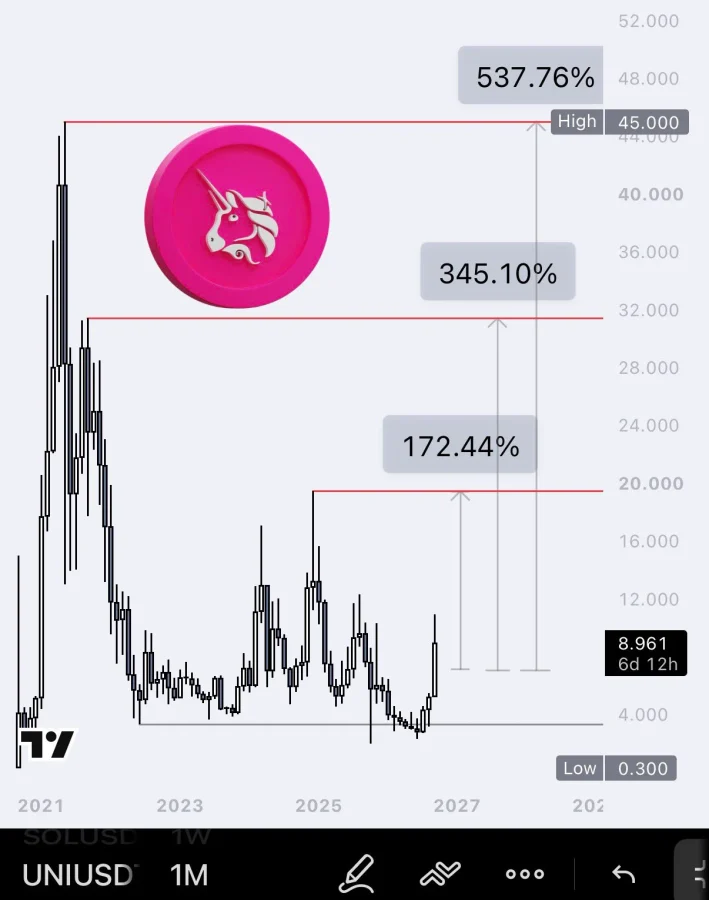
LAR identified the $7.50-$6.38 area as an important accumulation zone for UNI, noting that a monthly and weekly fair value gap (FVG) is developing there.
According to the analyst, this zone could be revisited and filled before the token resumes its broader upward move, creating another potential opportunity during a deeper correction.
Source: LAR’s X Post
The analyst also pointed to the 0.5 equilibrium zone as a key technical area that UNI is currently approaching.
The UNI price may struggle to clear this level on its first attempt, but a successful breakout could open the path toward the previous range high at $19.20, marking an important near-term target for traders.
Also Read: Uniswap Price Rises as UNI Breaks $9.50 Resistance After Rally
UNI Price Targets a Strong Move Toward $45
Beyond $19.20, LAR highlighted $31.43 and $45 as additional upside targets in the broader setup. The $45 level represents a potential new all-time high, although reaching these targets would require sustained bullish momentum and successful breaks through several resistance areas.
The analyst also emphasized that missed entries near $4 do not necessarily remove future opportunities.
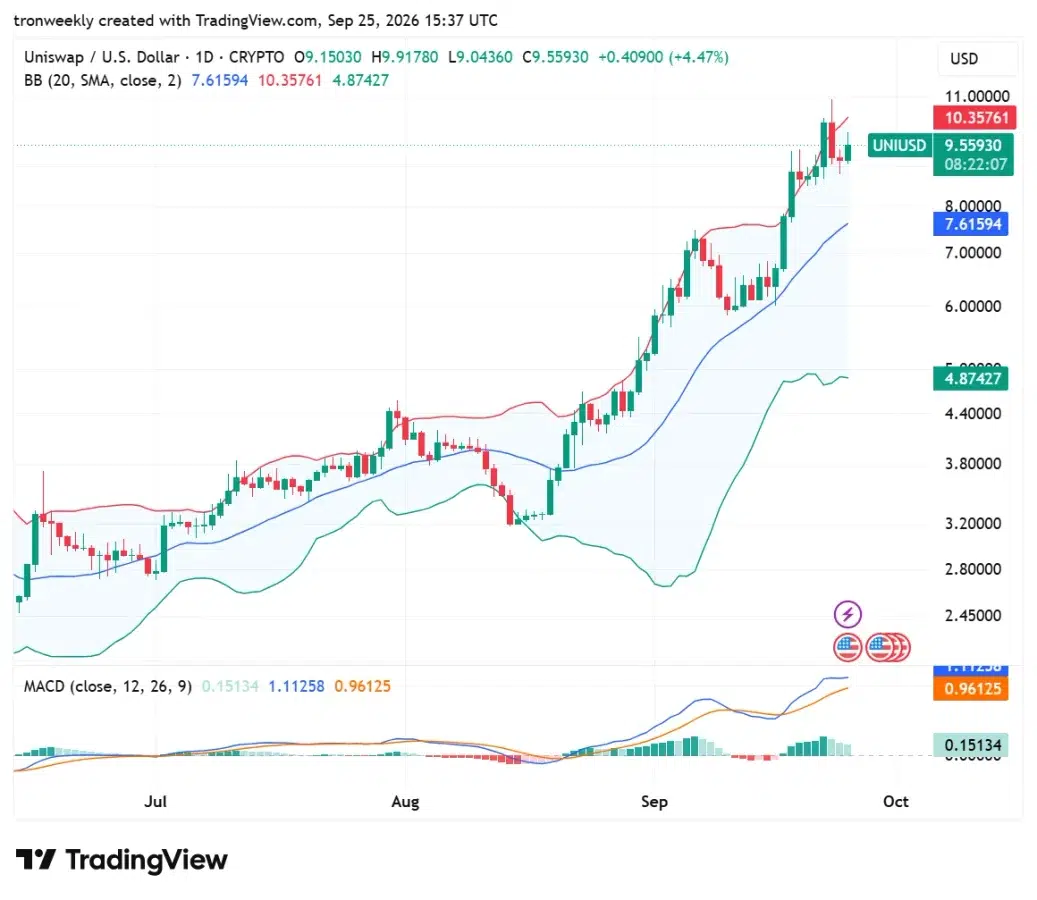
TradingView chart analysis supports the broader bullish structure, showing UNI rising from a consolidation area around $2.80-$3.20 in July toward a recent peak near $11.00.
UNI is trading at $9.55930, up 4.47%, and remained comfortably above the 20-day middle Bollinger Band at $7.61594, keeping the wider structure constructive and preserving its higher-low structure.
Price action, however, showed signs of temporary resistance near the latest peak. UNI remained close to the upper Bollinger Band at $10.35761, while recent candlesticks reflected mild consolidation and selling pressure.
This behavior suggests that the rally has entered a pause, with traders assessing whether momentum can support another breakout above the high.
MACD Indicator Signals Bullish Momentum
Momentum indicators continued to favor buyers, although the pace of the advance appeared to be slowing. The MACD line stood at $1.11258 versus the signal line at $0.96125, keeping the indicator bullish.
However, shortening histogram bars suggests that upward momentum is losing some velocity, which could increase the likelihood of consolidation before another directional move.
Source: TradingView
The Bollinger Bands also illustrate the expansion in volatility accompanying UNI’s recent rally. The lower band stood at $4.87427, highlighting the distance between the current price and the broader volatility range.
Meanwhile, the middle band around $7.61 remains an important dynamic support level if UNI experiences a pullback from current levels.
UNI Rising Open Interest Supports Outlook
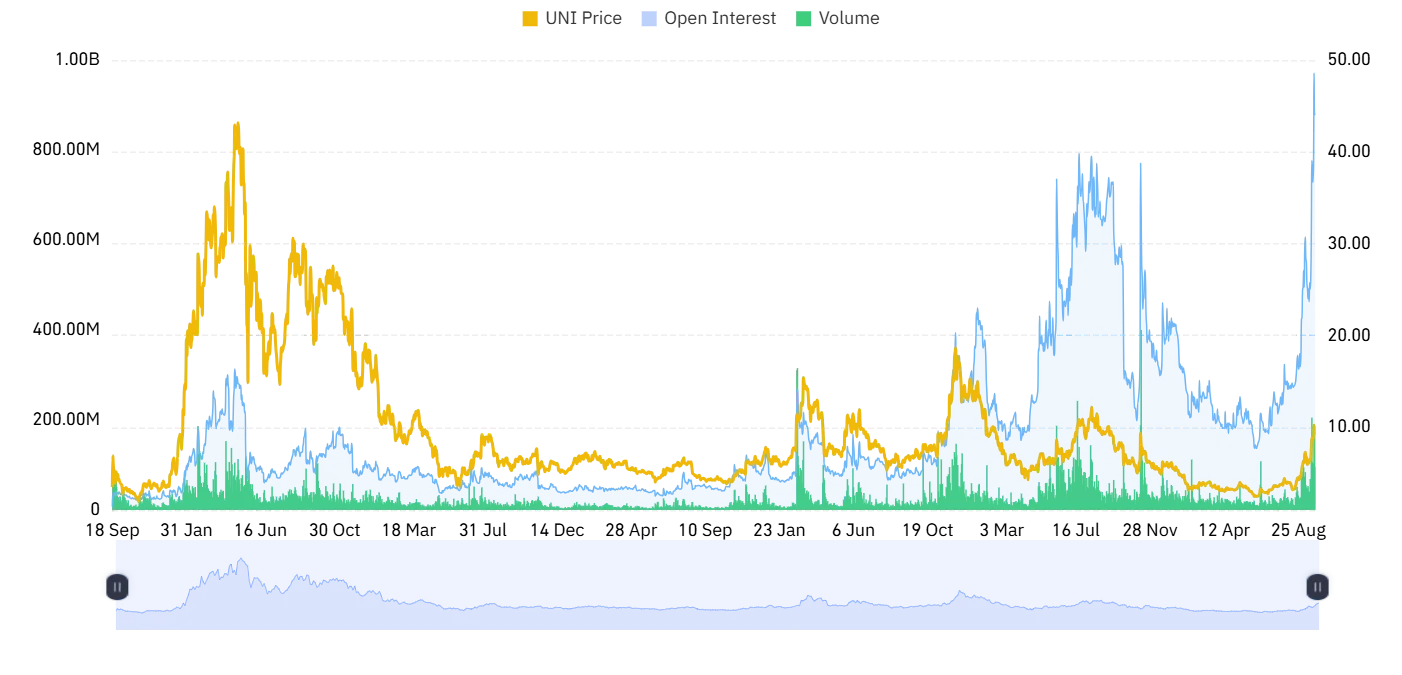
Derivatives data from CoinGlass showed a mixed but notable shift in UNI market activity. Trading volume declined 13.14% to $1.31 billion, while open interest increased 4.69% to $940.35 million.
The divergence indicates that futures positioning strengthened despite lower overall trading activity, suggesting increased derivatives participation while market turnover moderated during the period.
Source: Coinglass
The rise in open interest indicates that traders are adding or maintaining futures positions as UNI trades near its recent highs.
However, the simultaneous decline in volume suggests that the increase in positioning has not been accompanied by stronger overall turnover. This divergence will remain important as traders watch UNI for a breakout or renewed consolidation.
Whale Activity Adds Buying Interest
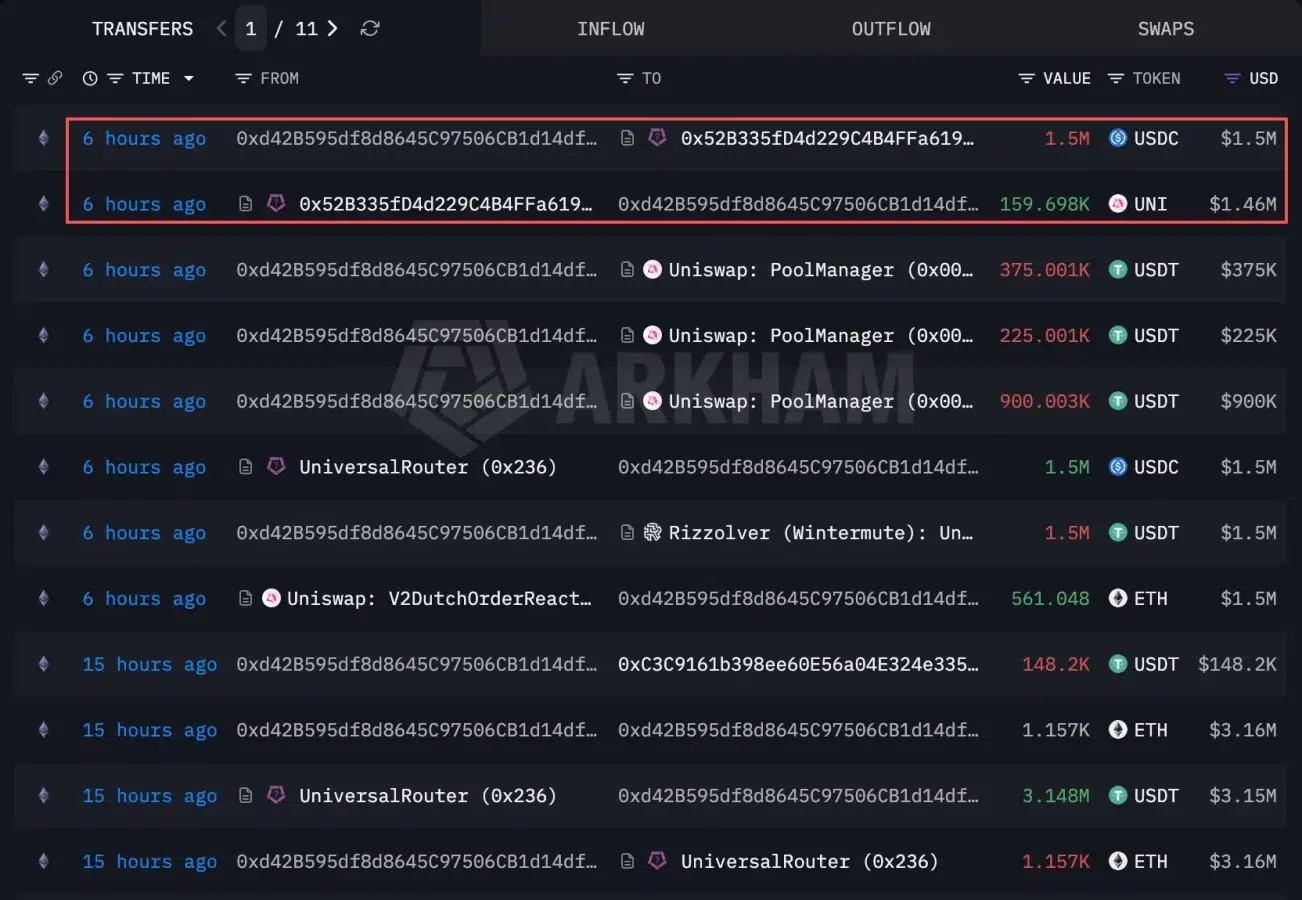
Whale activity also added another layer to UNI’s recent market structure. Lookonchain reported that whale wallet 0xd42B spent 1.5 million USDC to purchase 159,698 UNI at approximately $9.39 in a single transaction after the token declined.
The transaction highlights large-holder buying interest around the current price region following UNI’s recent pullback.
Source: Lookonchain’s X Post
The whale purchase occurred close to UNI’s current trading area, making the $9.39 level another notable reference point for market participants.
While a single transaction does not determine the broader market direction, the activity shows that large holders were willing to accumulate UNI during weakness rather than waiting for a deeper decline.
What Comes Next for the UNI Price?
With UNI trading near $9.56, market participants are now watching whether the token can reclaim the recent $11 area and eventually challenge the $19.20 range high.
Below the market, the $7.50-$6.38 FVG zone and $7.61 middle Bollinger Band provide key reference levels. A sustained breakout could shift attention toward $31.43 and $45.
Also Read: UNI Price Eyes a Strong Move to $20 as Whale Accumulation Strengthens Outlook
This article contains market analysis and price predictions. These are not guarantees. Crypto markets are volatile. Always DYOR. Not financial advice.