Uniswap price is now gaining strong traction in the market due to strong upward momentum being seen in the UNI price, supported by rising trading volumes and an important breakout formation that is attracting increased attention.
At the time of writing, UNI is trading at $3.19, with a 24-hour trading volume of $726.93 million and a market capitalization close to $2.00 billion. Over the last 24 hours, Uniswap’s price has surged 18.54%, showing a clear recovery after recent downside pressure and bringing new focus back to the token’s short-term direction.

Also Read | Standard Chartered Bets Big On DeFi Growth And RWA By 2026
Uniswap Breakout Could Double Price
On June 16, 2026, a well-known crypto analyst, World Of Charts, highlighted that the Uniswap price is nearing a major confluence point.
These areas of confluence come about when a long-term falling trendline intersects with a horizontal resistance line. Confluence zones are generally viewed as major pivot points, where the price either breaks through or bounces off.
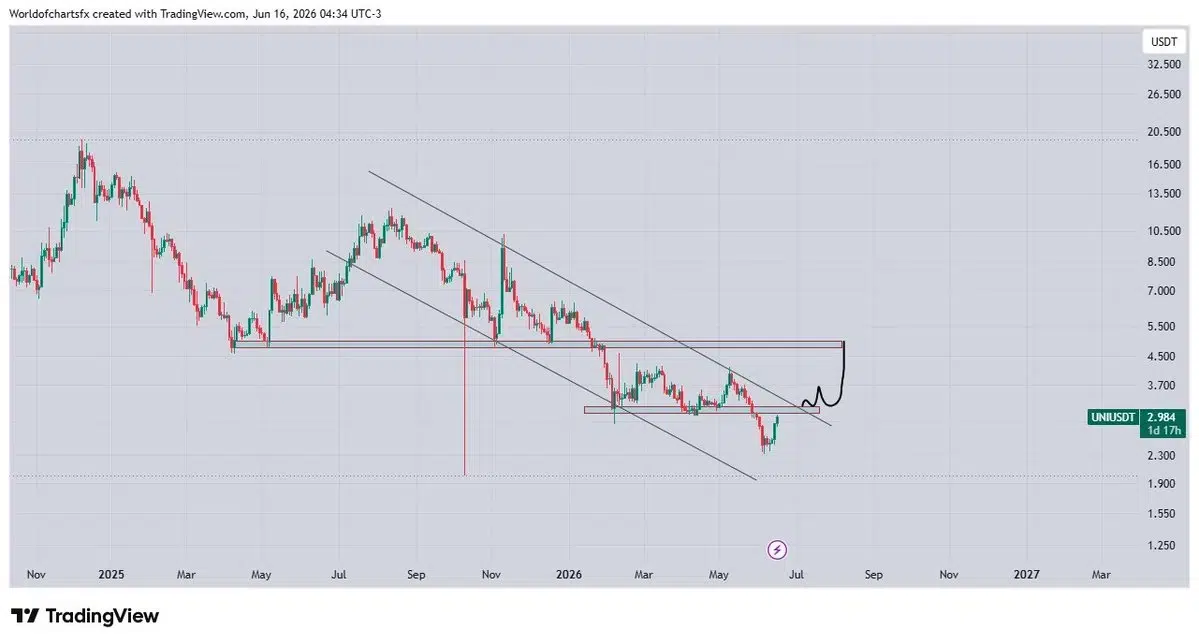
A Uniswap price breakout through this resistance would give way to a higher chance of embarking on an even more bullish journey. Concerning this structure, there is the likelihood of seeing a doubling effect over the next few months.
Uniswap Price Turns Bullish on Indicators
From recent market statistics, Uniswap has been advancing to about $3.223 after breaking through the middle Bollinger band of $2.77249.
Meanwhile, the upper Bollinger band is at $3.22310, and the lower band is currently at $2.22189. This increase in the gap is due to the increased volatility of the Uniswap price.

Positive momentum indicators have also appeared. The MACD indicator has reached the level of -0.12168 and is heading higher towards the signal line at the level of -0.19657.
The histogram indicator has turned positive at the level of 0.07489, which means that bearish pressures are easing off and Uniswap’s price is accumulating positive momentum.
Outlook for Uniswap price
In the short term, the future of the Uniswap price will be determined by whether or not it manages to break out from the resistance level. If a breakout takes place, then we should expect further upside movement. Otherwise, a period of consolidation will likely precede another test of the resistance level for the Uniswap price.
This article contains market analysis and price predictions. These are not guarantees. Crypto markets are volatile. Always DYOR. Not financial advice.
Also Read | Ethereum’s Staking Ratio Reaches 32.7% ATH