
Bitcoin sees recent sell-off pressure following a rally to the $87,000 mark due to profit booking, leverage unwinding and changing macro factors, amid concerns that the coin will be able to hold above the mid-$80,000s. The crypto rallied from the $84,500 mark up to $87,200 and is now trying to hold the $82,000 level, which is being tested amid weaker-than-expected U.S. jobs data.
Table of Contents
Bitcoin Faces Profit-Taking Near $87,000
The $87,000 area has emerged as an important short-term resistance zone after Bitcoin’s recent recovery.
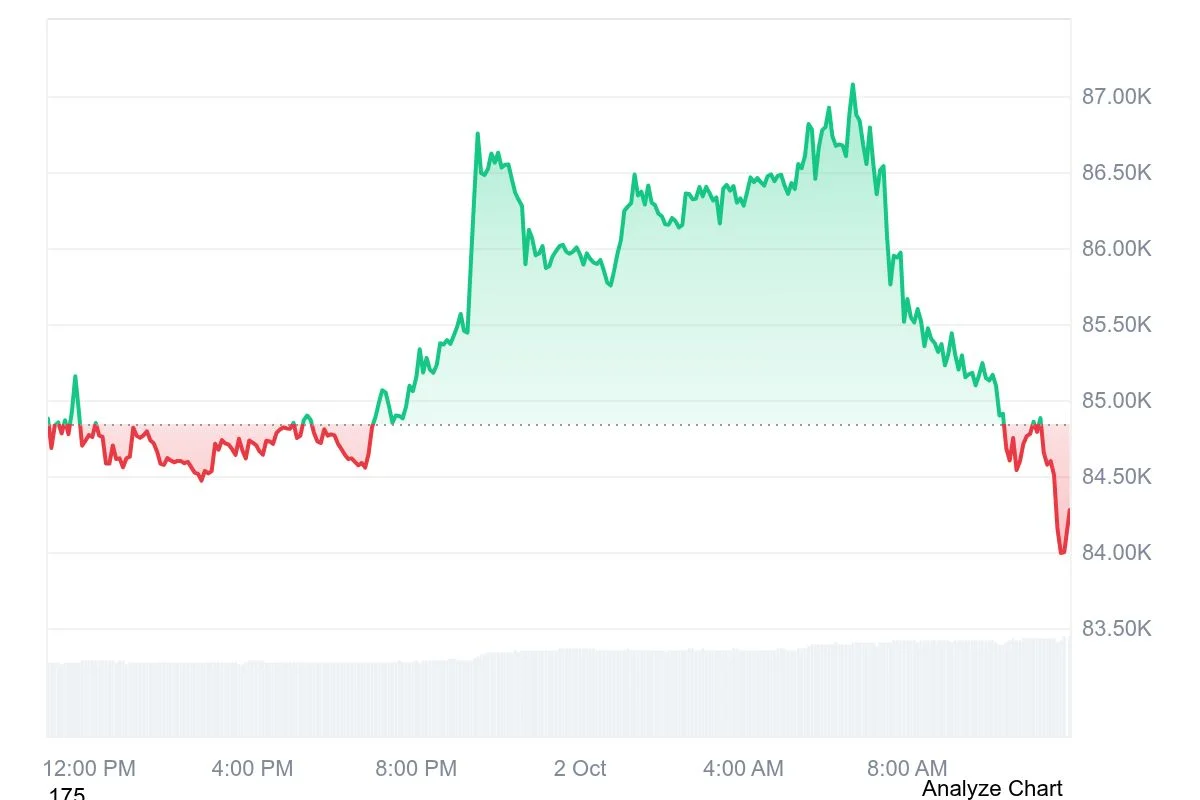
As BTC has already risen strongly from the $80k range, the probability of traders booking profits at the levels closer to the recent high becomes higher. Failure to break above the resistance immediately often leads to a reversal as the short-term players take profit.
BTC $87,500 level was found to be the next key resistance. Holding above the mid-$80k zone by the cryptocurrency may become crucial for further defining the nature of its recent rally.
$9.72M Bitcoin Long Liquidations Add Selling Pressure
On of the factor behind Bitcoin’s sharp reversal was a wave of leveraged liquidations. Analyst BullTheory highlighted that Bitcoin had climbed from $84,500 to $87,200 in roughly 15 hours, triggering about $216 million in short liquidations during the move higher. The rally was followed by a reversal that began about an hour after weaker-than-expected unemployment data was released.
Since then, Bitcoin has fallen by approximately $3,100, with roughly $278 million in leveraged long positions liquidated over a five-hour period.
The liquidation figures highlight how quickly leverage shifted during the volatile move. Short positions were heavily liquidated during Bitcoin’s initial rally, while leveraged longs bore the brunt of the subsequent decline.
U.S. Jobs Data Adds Volatility to Bitcoin
One more factor behind the volatility is the U.S. labor-market report released on October 2. The September employment report showed that U.S. nonfarm payrolls increased by only 29,000, well below the 90,000increase economists had expected. The unemployment rate also rose to 4.2% from 4.1%.
The weaker employment data initially reduced expectations for another Federal Reserve rate hike. For Bitcoin, the relationship with interest-rate expectations can be significant because lower expectations for future rate increases can affect Treasury yields, the U.S. dollar and broader risk appetite.
Bitcoin ETF Flows Remain Important
Spot Bitcoin ETF flows are another factor traders are monitoring. U.S. spot Bitcoin ETFs recorded $102.7 million in net inflows on October 1, according to Farside Investors. The inflow followed a $148.7 million net outflow on September 30, with BlackRock’s IBIT recording $195.6 million in inflows while Fidelity’s FBTC saw $60.7 million in outflows on October 1.
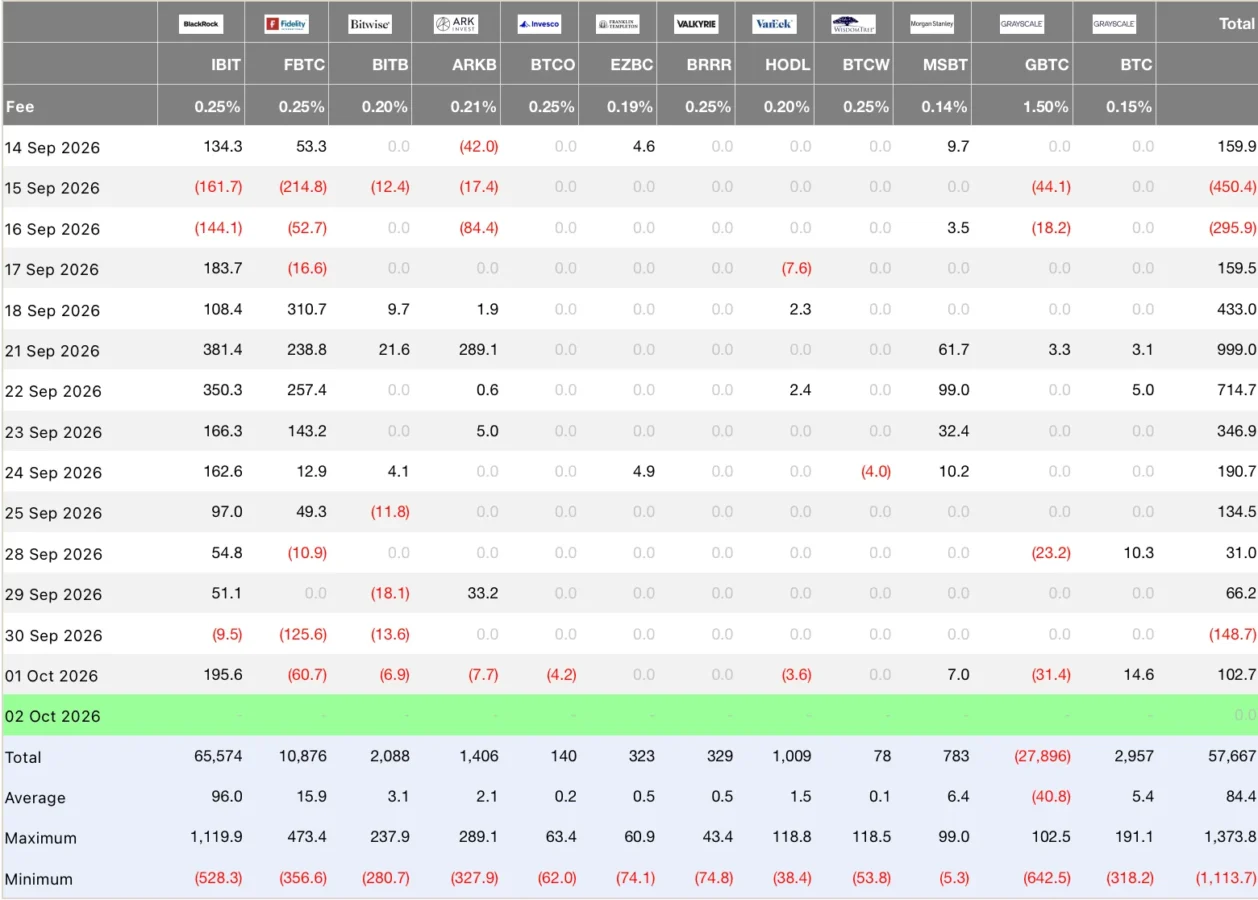
Source: Farside Investor
In general, the ETFs tracking spot Bitcoin in the United States have received a net inflow of approximately $2.39 billion during the September 21-25 trading week. According to the Farside’s data, the daily inflows amounted to $999 million on September 21, $714.7 million on September 22, $346.9 million on September 23, $190.7 million on September 24, and $134.5 million on September 25. As per the ETF flows, the share of BlackRock’s IBIT comprised approximately $1.16 billion, while Fidelity’s FBTC received around $701.6 million.
Based on the ETF flows, the appetite for spot exposure to Bitcoin has stayed positive amid the recent volatility in the price. Nevertheless, the ETF flows are not sufficient to identify the precise source of the buying pressure or to prove that the demand from institutions was the only factor behind Bitcoin’s moves. Therefore, both ETF flows and derivatives market provide a more comprehensive view on the market situation.
Bitcoin Price Prediction: Can BTC Hold $82,000?
Technically, the $82,000 level is still a crucial support level for Bitcoin. In terms of technical analysis, the area of 82,000 to 82,500 is a critical downside level. A more substantial decline to that level would indicate a bigger retracement from the highs, while a continued rise above $87,500 would bring attention back to resistance levels.
The immediate levels traders are watching include:
| Bitcoin Level | Technical Significance |
| $87,500 | Near-term resistance |
| $87,000 | Recent intraday high/resistance |
| 85,000-86,000 | Current trading and breakout area |
| 82,000-82,500 | Key downside support |
| $80,000 | Major psychological support |
| 73,500-75,000 | Deeper correction zone |
An upside break beyond the $87,500 area will see investors eyeing the $90,000 area, while a downside move below the $82,000 level will see a renewed interest in lower support levels. These are technical levels, not price targets.
Also Read: Citi Turns More Bullish on Bitcoin Price With New $113K Forecast
This article contains market analysis and price predictions. These are not guarantees. Crypto markets are volatile. Always DYOR. Not financial advice.